For this week, let’s talk about mapping (there is now a mapping section on the
data services portion of the NLC website). But first, a promise that this will be the last reminder for the
Digital Inclusion Survey (except for maybe one final e-mail to you next week if you have not yet completed it). The deadline has been extended until
December 12, 2014 and there are still
Three Kindle Fire HD’s up for grabs if you complete the survey. Enter your contact information at the conclusion of the survey to be eligible for the drawing. Also, don’t forget to complete the speed test by going to
www.speedtest.net from a public access terminal or laptop using the library Wi-Fi. Record the download speed, upload speed, and PING. Either enter the numbers into your survey, or e-mail them to me and I will enter the figures for you.
OK, on to the maps. Here at the Commission, a variety of mapping tools are used, including ZeeMaps, Google Fusion Tables, and Google Earth. Thanks to the help of Allana Novotny, things are looking up for understanding the complexities of these mapping tools. A word about collaboration: I mentioned Allana, and I think it’s safe to say had we not collaborated on these things, these maps either would not have gotten done or would not have had the same level of functionality. This has created a boost in my
creative confidence (and even analytical thought), and I’m grateful for that (thanks, Allana). On a similar note, if you look at the legislative map mentioned in the next paragraph and have suggestions, please let me know. While the Dude thinks his collaboration with Allana has been a good thing and produced some far out maps, there are other suggestions you might bring to the table, and that is always encouraged. Likewise, if you have ideas for an entirely different map illustration, please let the Dude know and he can possibly put something together for you. The Dude promises to at least try.
Anyway, the
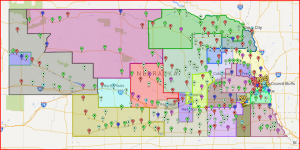
legislative map deserves a bit of explanation. The interactive map illustrates the legislative boundaries in the state and has markers for each public library. You can certainly zoom in to your district (or any other district for that matter) for a more detailed look. If you click on one of the districts (but not a marker), a pop-up should appear that tells you the district number, the senator, and a link to the senator’s website. This information is updated with the newly elected senators. Keep in mind that the corresponding webpages might not yet be updated with the new senator names and photos and other stuff, because that is done by the Legislature, not the Library Commission. The zoomable map is especially helpful in the Lincoln or Omaha areas. The Dude added the branch locations for Lincoln and Omaha libraries. If you click on the individual markers for each library, you get a pop-up that provides you with some basic information about the library, legislative district, senator, and a link to more information from the library profile on the NLC website. The markers are colored by service population, and you can filter those by checking or unchecking boxes on the legend at the bottom. The Dude hopes the map might be helpful to you.
Now, for a hint of what the Dude might currently be pondering for data illustrations:
The motion chart. The Dude mentions this because of an interest generated after watching the interesting
TED Talk by Hans Rosling. If you have a chance to, check it out (if for no other reason, the entertainment value of Hans going nuts over his data illustration) and feel free to give the Dude some ideas on how such a motion chart could be generated for Nebraska Libraries, or what data might be good to illustrate. This is in the brainstorming stage at this point, so feel free to provide some collaboration, or perhaps just an idea. The Dude welcomes a distraction from all these surveys. Shaka.
 For this week, let’s talk about mapping (there is now a mapping section on the data services portion of the NLC website). But first, a promise that this will be the last reminder for the Digital Inclusion Survey (except for maybe one final e-mail to you next week if you have not yet completed it). The deadline has been extended until December 12, 2014 and there are still Three Kindle Fire HD’s up for grabs if you complete the survey. Enter your contact information at the conclusion of the survey to be eligible for the drawing. Also, don’t forget to complete the speed test by going to www.speedtest.net from a public access terminal or laptop using the library Wi-Fi. Record the download speed, upload speed, and PING. Either enter the numbers into your survey, or e-mail them to me and I will enter the figures for you.
OK, on to the maps. Here at the Commission, a variety of mapping tools are used, including ZeeMaps, Google Fusion Tables, and Google Earth. Thanks to the help of Allana Novotny, things are looking up for understanding the complexities of these mapping tools. A word about collaboration: I mentioned Allana, and I think it’s safe to say had we not collaborated on these things, these maps either would not have gotten done or would not have had the same level of functionality. This has created a boost in my creative confidence (and even analytical thought), and I’m grateful for that (thanks, Allana). On a similar note, if you look at the legislative map mentioned in the next paragraph and have suggestions, please let me know. While the Dude thinks his collaboration with Allana has been a good thing and produced some far out maps, there are other suggestions you might bring to the table, and that is always encouraged. Likewise, if you have ideas for an entirely different map illustration, please let the Dude know and he can possibly put something together for you. The Dude promises to at least try.
Anyway, the legislative map deserves a bit of explanation. The interactive map illustrates the legislative boundaries in the state and has markers for each public library. You can certainly zoom in to your district (or any other district for that matter) for a more detailed look. If you click on one of the districts (but not a marker), a pop-up should appear that tells you the district number, the senator, and a link to the senator’s website. This information is updated with the newly elected senators. Keep in mind that the corresponding webpages might not yet be updated with the new senator names and photos and other stuff, because that is done by the Legislature, not the Library Commission. The zoomable map is especially helpful in the Lincoln or Omaha areas. The Dude added the branch locations for Lincoln and Omaha libraries. If you click on the individual markers for each library, you get a pop-up that provides you with some basic information about the library, legislative district, senator, and a link to more information from the library profile on the NLC website. The markers are colored by service population, and you can filter those by checking or unchecking boxes on the legend at the bottom. The Dude hopes the map might be helpful to you.
Now, for a hint of what the Dude might currently be pondering for data illustrations: The motion chart. The Dude mentions this because of an interest generated after watching the interesting TED Talk by Hans Rosling. If you have a chance to, check it out (if for no other reason, the entertainment value of Hans going nuts over his data illustration) and feel free to give the Dude some ideas on how such a motion chart could be generated for Nebraska Libraries, or what data might be good to illustrate. This is in the brainstorming stage at this point, so feel free to provide some collaboration, or perhaps just an idea. The Dude welcomes a distraction from all these surveys. Shaka.
For this week, let’s talk about mapping (there is now a mapping section on the data services portion of the NLC website). But first, a promise that this will be the last reminder for the Digital Inclusion Survey (except for maybe one final e-mail to you next week if you have not yet completed it). The deadline has been extended until December 12, 2014 and there are still Three Kindle Fire HD’s up for grabs if you complete the survey. Enter your contact information at the conclusion of the survey to be eligible for the drawing. Also, don’t forget to complete the speed test by going to www.speedtest.net from a public access terminal or laptop using the library Wi-Fi. Record the download speed, upload speed, and PING. Either enter the numbers into your survey, or e-mail them to me and I will enter the figures for you.
OK, on to the maps. Here at the Commission, a variety of mapping tools are used, including ZeeMaps, Google Fusion Tables, and Google Earth. Thanks to the help of Allana Novotny, things are looking up for understanding the complexities of these mapping tools. A word about collaboration: I mentioned Allana, and I think it’s safe to say had we not collaborated on these things, these maps either would not have gotten done or would not have had the same level of functionality. This has created a boost in my creative confidence (and even analytical thought), and I’m grateful for that (thanks, Allana). On a similar note, if you look at the legislative map mentioned in the next paragraph and have suggestions, please let me know. While the Dude thinks his collaboration with Allana has been a good thing and produced some far out maps, there are other suggestions you might bring to the table, and that is always encouraged. Likewise, if you have ideas for an entirely different map illustration, please let the Dude know and he can possibly put something together for you. The Dude promises to at least try.
Anyway, the legislative map deserves a bit of explanation. The interactive map illustrates the legislative boundaries in the state and has markers for each public library. You can certainly zoom in to your district (or any other district for that matter) for a more detailed look. If you click on one of the districts (but not a marker), a pop-up should appear that tells you the district number, the senator, and a link to the senator’s website. This information is updated with the newly elected senators. Keep in mind that the corresponding webpages might not yet be updated with the new senator names and photos and other stuff, because that is done by the Legislature, not the Library Commission. The zoomable map is especially helpful in the Lincoln or Omaha areas. The Dude added the branch locations for Lincoln and Omaha libraries. If you click on the individual markers for each library, you get a pop-up that provides you with some basic information about the library, legislative district, senator, and a link to more information from the library profile on the NLC website. The markers are colored by service population, and you can filter those by checking or unchecking boxes on the legend at the bottom. The Dude hopes the map might be helpful to you.
Now, for a hint of what the Dude might currently be pondering for data illustrations: The motion chart. The Dude mentions this because of an interest generated after watching the interesting TED Talk by Hans Rosling. If you have a chance to, check it out (if for no other reason, the entertainment value of Hans going nuts over his data illustration) and feel free to give the Dude some ideas on how such a motion chart could be generated for Nebraska Libraries, or what data might be good to illustrate. This is in the brainstorming stage at this point, so feel free to provide some collaboration, or perhaps just an idea. The Dude welcomes a distraction from all these surveys. Shaka. 
