Search the Blog
Categories
- Books & Reading
- Broadband Buzz
- Census
- Education & Training
- General
- Grants
- Information Resources
- Library Management
- Nebraska Center for the Book
- Nebraska Memories
- Now hiring @ your library
- Preservation
- Pretty Sweet Tech
- Programming
- Public Library Boards of Trustees
- Public Relations
- Talking Book & Braille Service (TBBS)
- Technology
- Uncategorized
- What's Up Doc / Govdocs
- Youth Services
Archives
Subscribe
Author Archives: Sam Shaw
The Data Dude on Social Media – Pt. 2
 After last week’s post, which admittedly was thrown together at the last minute in order to meet the one post a week deadline (yes, I’m playing a self-inflicted weekly match-it game with Lori Sailors), the Dude got to thinking more about libraries and social media. If you look at the library markers on the public library maps from the NLC website, there are links to selected social media sites for each library (e.g. Facebook, Twitter, and Flickr). The bar chart to the right uses the data from the map, showing the distribution of social media sites used by Nebraska libraries. The data comes from the NLC supplemental survey, and after looking at the supplemental survey, some revision might be in order. How many of you have active Delicious accounts? LibraryThing? These are both options on the supplemental survey but not Pinterest or Instagram. Well, perhaps we will work to revise the supplemental survey so that these might be options. Are there others? If so, let me know.
Now, as the chart illustrates, Facebook (or is it facebook?) is the dominant force here (if you don’t understand why, check out last week’s post (or just look at the bar chart) for a better understanding of the dominance of facebook. Perhaps you could also double check your marker on the aforementioned maps to make sure that they provide the correct link to your library’s social media pages. If they don’t, you can update that information via the supplemental survey. This can be done at any time, although reminders are sent around the time of the public library survey.
Arguably, what’s more important is keeping your social media sites updated. Having a twitter account and only tweeting once a year is neither worthwhile nor effective at getting your message out there. Which brings the Dude to the next point and that is what icon to use for these various sites. Facebook isn’t too difficult, anything with the lower case f on a blue background. Twitter, however is a bit trickier. Do you use the lower case t or one of the variations of the little birdy? Do we assume that everyone knows that the birdy represents twitter? For Pinterest, the cursive p will do, but should you choose the circle or square background? Flickr’s are a bit more complicated, with numerous blue and pink dots and various renderings of lower case fr’s. The Dude imagines that someday we will have throwback icons similar to that of baseball uniforms and soda packaging (if we don’t already). Shaka.
The Data Dude on Social Media Use
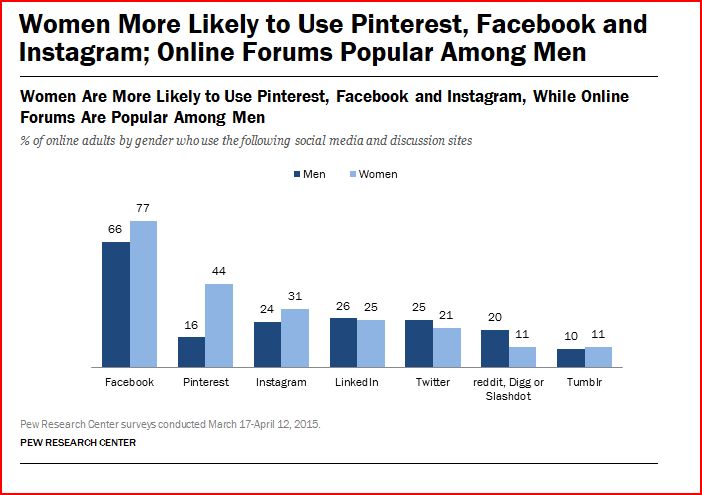 Today’s post will be a little blip about social media use. A recent Pew Research Center study took a look at gender and social media use and compared it to findings from previous years. While there once was a noticeable gender gap between men and women (with women being more likely than men to use social media), there is no longer such a noticeable difference. Does your library use social media? If so, what do you use and for what purpose? If you are interested in setting up social media sites or pages are you aware that there is help from the Nebraska Library Commission? If you’ve been meaning to do this but need some assistance, contact the NLC Technology and Innovation Librarian, Craig Lefteroff.
According to the Pew survey, there are some differences in the type of social media used by gender. As the chart indicates, Facebook, while still used more by women than men, remains the most frequently used site overall. Pinterest is dominated by women, and men are more likely to use discussion forums and slightly more likely to use Twitter. The point to this is to have a better understanding of the various social media options for your library, and to understand the benefits of using social media to reach your community. Of course, this is only the starting point in gathering data on the demographics of your local community. Another great source for information to help with setting up and maintaining a social media site is the Nebraska Libraries on the Web site and blog. Check it out and you might come away with a fresh new idea or two. Shaka.
Friday Reads: The Antidote by Oliver Burkeman
 My original intention was to write a bit about the Wisdom of Insecurity, authored by Alan Watts and published in 1951. The reasons for this include the fact that I just recently read it, and Watts demonstrates a directness and clarity that is refreshing. The book reads like it could have been written today:
“Human beings appear to be happy just so long as they have a future to which they can look forward – whether it be a ‘good time’ tomorrow or an everlasting life beyond the grave. For various reasons, more and more people find it hard to believe in the latter. On the other hand, the former has the disadvantage that when this ‘good time’ arrives, it is difficult to enjoy it to the full without some promise of more to come. If happiness always depends on something expected in the future, we are chasing a will-o’-the-wisp that ever eludes our grasp, until the future, and ourselves, vanish in the abyss of death.”
And …
“For this stream of stimulants is designed to produce cravings for more and more of the same, through louder and faster, and these cravings drive us to do work which is of no interest save for the money it pays-to buy more lavish radios, sleeker automobiles, glossier magazines, and better television sets, all of which will somehow conspire to persuade us that happiness lies just around the corner if we will buy one more.”
Well, the appeal of Watts (described in many circles as playing a large role in bringing eastern philosophy to a western crowd) is not just in the one-liners. His writing appears to come at least somewhat from the perspective of the ever increasingly trendy “living in the moment” prescription, but also is perhaps at least a precursor to the deeper notions and variants of nondualistic pantheism. After reading Watts, it seemed fairly easy to sum these major points up; I was looking for something with a bit more depth. Oliver Burkeman’s the Antidote provides a little more of that. I say a little because much of what Burkeman writes about is quite similar to Watts, but there is some new material here that is worthwhile. Burkeman’s ideas might at least be a decent starting point.
Burkeman’s title provides some degree of a play on words (whether intended or not) in that the antidote he describes is something to counteract one’s unhappiness and the fact that he provides numerous anecdotes throughout the book. Burkeman draws from many sources, largely from the work of Stoicism and Albert Ellis and smally on things like the Museum of Failed Products, the self-help industry, Zen Buddhism, meditation, Mt. Everest climbers, Eckhart Tolle, and memento mori. Burkeman makes good arguments against the preoccupation with goals, less intensive planning, and ditching the modern day “cult of optimism.” Burkeman notes that “it is our constant efforts to eliminate the negative – insecurity, uncertainty, failure, or sadness – that is what causes us to feel so insecure, anxious, uncertain, or unhappy.”
It might be easy to conclude that Burkeman is advocating negative thinking. He’s not. There is a clear differentiation between negative thinking and the prescribed (stoic) rational thinking.
One perplexing notion, at least to me and requiring further thought and reflection is this aforementioned notion of “living in the moment”. It seems to me that consciousness plays a large role in it, and if a person is consciously thinking about something (including living in the moment), can they really be doing or experiencing it? If we perpetually read books, attend seminars, or participate in groups that bring this idea front and center, can we ever really achieve it under those circumstances? Probably not, and I think Watts would agree: “To understand music, you must listen to it. But so long as you are thinking, ‘I am listening to this music,’ you are not listening.” At any rate, if you are looking at an alternative to the positive thinking machine, the Antidote might prove to be a good read, and might turn you on to some other thought provoking stuff.
The Data Dude – Wednesday Watch: SOA and Silicon Valley
 Today’s Wednesday Watch will focus on a snippet (ok maybe a bit more than a snippet) of FX’s Sons of Anarchy (SOA), a show the Dude really wanted to like but abandoned in the middle of the final season (to be honest, it should have happened much earlier). After the SOA analysis, the post will then shift to a new show with high hopes that is thus far exceeding expectations, HBO’s Silicon Valley.
First: The bad. Sons of Anarchy (various seasons) are part of the holdings of approximately 5 or 6 Nebraska public libraries, depending on the season. If your library is considering it, the Dude recommends that you put your money toward something else gangster-related (such as the Sopranos or the Wire), and spend the rest on Silicon Valley (see below). Yes, SOA does have some high points, generally during the first two seasons, and often centered on the witty one liners coming from Katey Sagal (Gemma) or Ron Perlman (Clay). The acting on the show is solid; however the low point is the unravelling of the show’s writing over time into the abyss of absurdity. SOA creator and writer Kurt Sutter has a response to the Dude’s criticism, namely that all the other non-haters “get it”, and we simply don’t. Well, that may be the case, but our disappointment comes from the fact that we believe the show could have been much better, if the unbelievable, irrational parts were sufficiently cleaned up. And it had potential. Without giving away too much, let’s dive in a bit as to why SOA misses the mark. The Dude started watching the show at the urging of various individuals, including some motorcycle aficionados. Now for the record, the Dude isn’t particularly interested in cycles (except for the human powered kind), but certainly has nothing against them. Not quite mid-way through the final season, the Dude had enough, and didn’t even have the desire to see how the show ended. Yes, it was that disappointing. Here are the reasons why.
Number one: The overuse of the musical montage. Works occasionally, but too much of even a good thing is well, a bad thing. Some of the music comes across as just plain tacky (e.g. changing the lyrics in “House of the Rising Sun” from “New Orleans” to “Charming Town” – the fictional town where SOA takes place) and at other times it’s just plain clichéd. As the series goes on, the musical montage gets more and more used and thus more and more annoying.
Number two: The prison scenes started out just OK, but became completely unbelievable over time. Well, it should be noted that they held a period of believability on a sensationalized, Hollywood version of what occurs behind bars. Even if we accept the fact that some of this stuff is a bit overblown, what writer Kurt Sutter’s character (Otto Delaney) is able to accomplish in prison is pretty comical when you think about it. All of it could never happen that way. The difficult part to swallow is that Sutter seems to have no problem serving it up on a platter with the manner of Anthony Hopkins in the Remains of the Day. The truth of the matter is that for most people who are either in prison or work there it is a mundane, repetitive, smelly, depressing, argumentative, limiting environment with small amounts of possessions and privacy that zaps one’s daily energy (inmates and staff). Admittedly, it is in fact an environment charged with violence, testosterone, manipulation, and sexuality, but to a much lesser degree than portrayed by Sutter.
Number three: The level of trust demonstrated by certain rival gang members that ultimately leads to their murder is off base. Some of these characters are hyped up as “major playas”, yet when they have a sit down with another gang and they roll in with only 2 or 3 of their crew and when they sometimes turn their backs on potential rivals, it ultimately leads to their predictable demise. It happens more than once, and it seems that guys of this caliber (if you believe the hype from the accompanying dialogue) would roll in on 3-4 tinted window Escalades or Suburbans, after setting up a few guys on the perimeter ahead of time, and toting no less than a few machine guns. And never, ever, turn their backs on anyone or exhibit any degree of trust. Furthermore, some of the alliances formed among the various thugs (under the circumstances) seem a bit perplexing or preposterous.
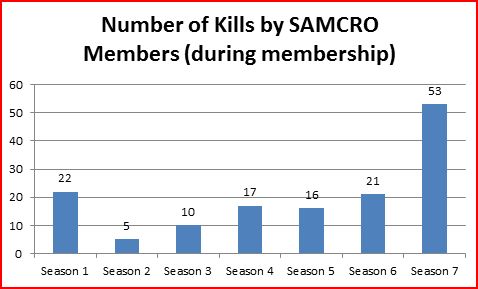
Number four: The kill count. Basically, the crew consists of about 8-9 guys, give or take throughout the series. True, the club has numerous other “charters” in different towns or cities, but the core group, SAMCRO (Sons of Anarchy Motorcycle Club, Redwood Original – the main charter) is generally around or less than 10 guys. The kill count for just the members over the 7 seasons is a whopping 144 (see chart). By comparison, the total deaths (including those not directly caused by Tony’s crew) in the Sopranos was 92. Some of these SOA kills are of the persuasion that they would most likely draw significant attention from not just local but national law enforcement.
 Number five: The continuity errors. This is a minor complaint, but part of a larger criticism related to editing as a whole. Every show has these types of errors and they sometimes are noticeable, sometimes not. On SOA, they seemed to be noticeable and distracting, and for a show of this caliber, it was unexpected. These include blood and tattoos that either disappear or change places from scene to scene, cars that change make and model from scene to scene, actors that have or wear items then don’t have them, etc. It’s a minor complaint, but a complaint nonetheless. Details matter.
Now on to Silicon Valley. According to WorldCat, season 1 is held by just 2 Nebraska public libraries. The show follows main character Richard Hendriks (Thomas Middleditch) and his friends or colleagues (however you might see it) who all live together under one roof in a startup incubator in or near Palo Alto. Erlich Bachmann (played brilliantly by TJ Miller, and adequately filling the no-nonsense sharp witted gap left by the departure of Roger Sterling) lets Richard and his friends stay in his house rent free in exchange for a 10% stake in the projects they invent while living in the incubator. Richard develops a powerful search algorithm (Pied Piper) and the show follows the path from Pied Piper’s inception to startup, as well as the rest of the Silicon Valley world. Now, before someone mentions that there is a certain degree of unbelievability in Silicon Valley (see SOA criticism above), the difference is that Silicon Valley isn’t pretending to pass everything off this way (as SOA is with a straight face).
The show’s creator, Mike Judge (Beavis and butt-head, Office Space, King of the Hill) has previously worked at a Silicon Valley startup, and does a pretty good job of satirizing the culture. Although some, such as Elon Musk, are not quite as amused. Now for the record, the Dude is a Musk (and Tesla and Solar City) fan, although his frequently quoted response to Silicon Valley actually does more to prove that the HBO series hits, rather than misses the mark. Musk is quoted as saying:
“I really feel like Mike Judge has never been to Burning Man, which is Silicon Valley. If you haven’t been, you just don’t get it. You could take the craziest L.A. party and multiply it by a thousand, and it doesn’t even get … close to what’s in Silicon Valley. The show didn’t have any of that.” Judge didn’t bite when he responded to Musk’s comment, merely stating that: “I mean, he’s Elon Musk and he knows more about the tech world than I do, so I would never argue with that. But we’re doing a comedy. This isn’t a documentary.” In a way, Musk’s comment seems self-satirizing (read it again a few times and it will become more apparent). TJ Miller also had an apt response: “Yeah, but, and I’m not gonna name names, but if the billionaire power players don’t get the joke, it’s because they’re not comfortable being satirized, … And they don’t remember that to be a target of humor is an honor — you have to be venerated to be satirized. Like, I’m sorry, but you could tell everything was true. You guys do have bike meetings …”
For the record, perhaps Judge will think of a way to work Musk’s thoughts into a future episode, and I could go on about Burning Man and Silicon Valley, but it would be hard to beat this Burning Man spoof (complete with a great Petyr Baelish imitation). Shaka.
Posted in General, Library Management, Technology, Uncategorized
Leave a comment
The Data Dude on the Pie Chart

 A lot of so called data presentation experts have taken to bashing the use of the pie chart. Notably, data man Edward Tufte has led this crusade, proclaiming that “the only thing worse than a pie chart is several of them.” Perhaps a bit more subtle, Stephen Few has written a lengthy tirade called Save the Pies for Dessert. While it might be easy to conclude that because someone with Tufte’s or Few’s credentials believe that pie charts are rubbish then it holds that they are in fact rubbish, such a generalization would be a good example of the logical fallacy ad verecundiam (appeal to authority). The Dude won’t fall into that trap, and Tufte won’t get a free pass either. The truth of the matter is that pie charts can be effective, as long as they illustrate the point that you are trying to make and you follow some simple rules.
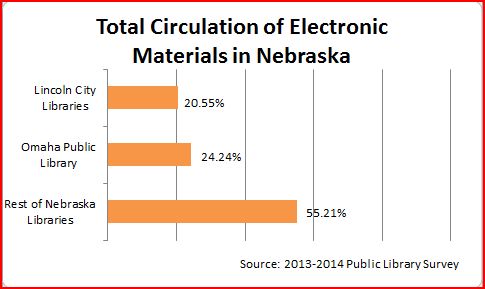
The Dude did a few quick charts in Excel for the purpose of demonstration (see right), and here is a brief example of a situation where a pie chart might be a more effective method to displaying the data and get your point across. The following charts show the circulation of electronic materials in Nebraska, using data from last year’s public library survey. Which one more effectively illustrates the data? If you are considering a pie chart, let’s summarize a few basic points.
Number 1: Keep it simple. Skip the 3d crap options that excel has if you are doing it in excel. This is analogous to the presenter using every, and I mean every, transition between power point slides (the fade, flip, dissipate, well, you get the idea). It’s almost as annoying as a single person (or family of 2 or even 4 for that matter) driving a GMC Yukon Denali. Unless, of course, the Denali is fitted with baller rims or you should happen to be visiting the summit of Mauna Kea.
Number 2: Label things and provide your sources, but don’t go overboard. The key here is that your chart should be readable. You be the judge of that.
Number 3: Don’t have too many slices in your pie chart. There are countless examples of too many slices. Here is one from the Australian Recording Industry Association (ARIA) Music Awards.
Number 4: Consider an alternative such as bar, stacked bar (a/k/a Don Draper’s living room), or just numbers (make them large and add some color). If you have numerous charts in your report, try mixing it up with different charts or even use some tables. Don’t make every chart a pie chart (or a bar chart for that matter).
Number 5: If the pie doesn’t work, resist the urge to replace it with a donut chart. Remember that a donut chart is just a pie chart with the unnecessary “premium” trim package. This is like a Lexus instead of a Toyota. It’s all the same.
Number 6: Pie charts aren’t the best choice when making comparisons (side by side pie charts don’t work as well as, say a bar chart).
Number 7: Pie charts have 25% built in – everyone knows where 25%, 50%, and 75% are on a pie chart. Keep that in mind if your data is close to those ranges.
Number 8: Always include citations to your sources.
Shaka.
Posted in General, Library Management, Uncategorized
Leave a comment
The Data Dude – Broadband in Underserved Areas
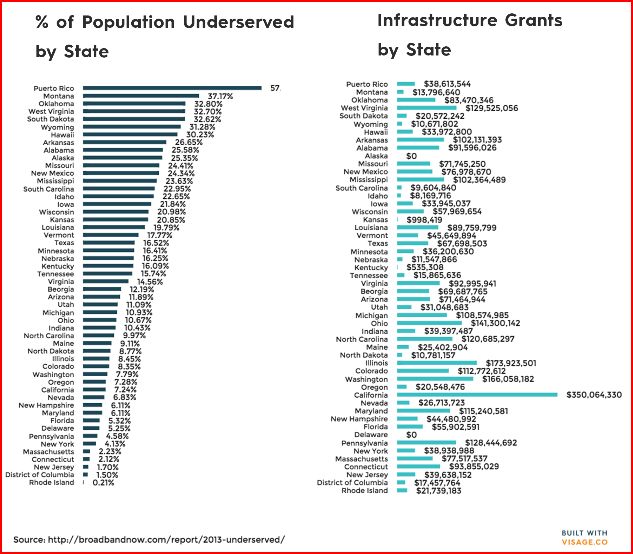 The Dude was knee deep in working on a rant, er, rather, an informative post, about pie charts when he came down sick with a nasty head cold and allergy attack. It seems like the kind that a few expired Allegra poppers might not immediately eradicate, so it’s on to Plan B, which for this week is remote desktop access courtesy of the NLC CompTeam (thanks, CompTeam) and a short tidbit on broadband (now defined by the FCC as 25 Mbps downstream) and underserved areas. As a part of this report, FCC Commissioner Jessica Rosenworcel said: “We can do audacious things if we set big goals, and I think our new threshold, frankly, should be 100Mbps.” Good progressive thinking, Jessica.
While it is axiomatic that libraries play a huge role in bridging the underserved gap (especially in smaller communities), how does Nebraska rate as far as underserved areas (and infrastructure grants)? Well, you could try to decipher the massive bar chart above, or look at this simple graphic I created (you might have to click to enlarge):

Shaka.
Posted in General, Library Management, Technology, Uncategorized
1 Comment
The Data Dude on Census Narrative Profiles
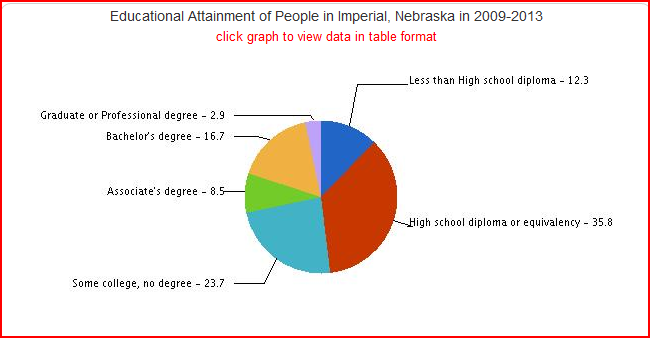 As a number of you work through your accreditation applications, you might also be reviewing your strategic planning documents. Today’s post is about the Narrative Profile from the Census Bureau’s American Community Survey. As you gather information about your community, this simple yet powerful tool might help you with your planning. The Narrative Profile covers 15 different topic areas; users can start their search by zooming in on a map or by using dropdown menus (Step 1). For today’s illustration, a library community was chosen at random, the Lied Imperial Public Library, or the Imperial, Nebraska community.
Here is how you get your Narrative Profile: After choosing “Dropdown Menus” from Step 1, you then select a geography level from step 2. In this case, Imperial is a “Place”, so we select Place and then Nebraska > Imperial city, Nebraska from Step 3. There are other options besides place, including geography levels such as county, Census Tract, Zip Code, or Metropolitan/Micropolitan Statistical Area (Metropolitan=core urban area of 50,000 or more population; Micrpolitan=core urban area of 10,000 or more population, but less than 50,000). After the place of Imperial is selected, there is a link at the bottom that says “Get Profile”. Clicking on this spits out a report that you could either print, save, or copy and paste parts of it, including the many charts and graphs that it contains. The data covers 2009-2013.
The report contains data from various topical areas. For starters, if we look at household data there are 900 households in Imperial, of which 52% are married couple families. There are 30.8% persons that live alone and 17.2% are other families or nonfamily households. 14% of the population in Imperial spoke a language different than English at home, and 94.2% of that 14% spoke Spanish. The education data is expressed in a pie chart that was generated in the Narrative Profile, located at the top of this post (click on the chart to expand and actuall read it).
There are many additional categories, including data tables and illustrations such as the one above. Some of these are employment status and type of employer, industries (retail trade is the highest at 26.7%), occupations, commuting to work (81.1% drive alone and 9.8% walked), income (women, unfortunately make about $14,000 less than men in Imperial), poverty rate (12% overall), health insurance (16% do not have insurance), population age distribution, and housing characteristics.
While the Narrative Profile certainly isn’t as comprehensive as the reports you can build from the Advanced Search section on American FactFinder, for a quick snapshot of your community it’s a good starting point. And it has the extra benefit of producing some nice basic charts and graphs that you are free to copy and paste. The Dude likes not only reliability, but simplicity. Shaka.
Posted in Census, General, Information Resources, Library Management, Uncategorized
Tagged census
Leave a comment
The Data Dude – Basic Public Library Survey Guide
 Shaka. The purpose of today’s post is to let you know about a new basic public library survey and Bibliostat™ guide that has been posted on the NLC website. If you are new to the IMLS public library survey or are looking for a brief refresher, this is a good place to start. Bibliostat™ is the data collection tool that Nebraska currently uses to collect data for the public library survey. States are free to use whatever method they choose; in Nebraska it is Bibliostat™. The aforementioned guide also has a bit of background about the public library survey, as well as the basic Bibliostat™ navigation. You can also print a copy of the survey and instructions from the data services section of the NLC website. This may help you to compile some of the data ahead of time, instead of scrambling around at the last minute. As always, if you have questions, don’t hesitate to ask.
The Data Dude – Wednesday Watch: the Black
 Before the Dude explores this week’s Wednesday Watch, a shout goes out to Pete Kostelnick, a Lincolnite who won this year’s Badwater 135 Ultramarathon. The Dude has previously written about Badwater, and wants to acknowledge Pete’s accomplishment. The running world is yours, Pete. The rest of us just live in it.
Now today let’s take a look at two TV series offerings (available on DVD from your local library). The first, Orphan Black, is from BBC America (via the Canadian Space Channel), and the other, Black Mirror, is from British Channel 4. Orphan Black came highly recommended by a number of individuals, and the Dude was hyped up after a few episodes. Toward the end of season 1, his buzz was decimated. And thus, unfortunately, Orphan Black cannot be recommended. There are, however, some positives, but they don’t really outweigh the negatives. According to WorldCat, 5 public libraries have season 1 of Orphan Black. The premise of Orphan Black is this: A woman named Sarah sees another woman (Beth) commit suicide by jumping in front of a train. Just before the act, Sarah eerily notices that Beth looks identical to her. Immediately after the suicide, Sarah steals Beth’s identity and eventually discovers that not only are she and Beth clones, identical in appearance and genetic material, but there are numerous other clones in addition to the two of them. At first, the notion seemed intriguing, and this appeared to be a fresh new go-to show, but the feeling didn’t last. In fact, the Dude had placed a hold on the season 2 DVD’s, but returned them unwatched. Yes, it was that disappointing. Tatiana Maslany, the actress who plays the clones, does do an excellent job. The problem, however, has to do with what would be considered unrealistic script writing, introducing characters that otherwise appear quite reasonable and placing them in situations where they act quite unreasonable. The Dude found it not so much believable. But wait! Perhaps it is somewhat due to budget restraints. The same feeling of un-believability occurred when watching FX’s Sons of Anarchy. The show was intriguing, or a little above meh, but that’s about it. On the sci-fi front, because it seems like that is the theme here this week, the Dude is anxiously awaiting and has high hopes for HBO’s upcoming Westworld.
Compared to Orphan Black, the British Channel 4 series Black Mirror presents an entirely different level of exoticity. The Dude was disappointed to discover that no Nebraska libraries have season 1 of Black Mirror, and just 20 libraries in the world have it, according to WorldCat. Black Mirror would be a great choice to add to your library’s DVD collection. How to describe Black Mirror? Well, it’s often been said it’s like an updated, technologically marinated version of the Twilight Zone. That would be a fair assessment, along with the fact that it is often just plain creepy. Like, look over your shoulder if you are watching it late at night or Twin Peaks-y bad dreams after you watch it type creepy. Like that. And the Dude doesn’t generally like creepy things, because, well, they often result in the Dude feeling creepy, and the Dude doesn’t like that. The series creator, Charlie Brooker, asks the question: “If technology is a drug – and it does feel like a drug – then what, precisely, are the side-effects?” Black Mirror explores this premise, in the disconnected, dirty, and often hopeless way that technology sometimes leaves us feeling. Like the Twilight Zone or Alfred Hitchcock Presents, each episode stands on its own, with different characters in different situations.
One side effect of the show is that it does provoke thought about technology, its use, and its application, and (the Dude won’t sugar coat it), it often isn’t good. To a certain extent fear, loneliness, and disconnection married to technology breed a pessimistic cocktail indeed. At least technology has that potential; to feed the worst parts of our souls. OK, enough with the philosophical pessimism (the Dude has been reading Schopenhauer on and off this month), let’s tie this into libraries somehow.
The defining factor is that both the library of the 21st Century and even the critic of the 21st Century library often rely too much on technology as a solution to societal problems or even societal wants. While technology does play an important role (the Dude won’t argue that point), the library of the future should transcend it. It’s not an either/or proposition (as many see it), but rather a Ken Wilber-esque integral type of theory. We need not double-down on technology, but rather walk away from the casino with some real life human connection. In the age of what Brooker aptly refers to as the Black Mirror, we are often left with a numbness or certain icky-ness feeling that seems more like an infinite means to an end rather than the technology and human ends in themselves. Libraries may be able to help alleviate those feelings, but it has just as much (or more) to do with us than the library as a modern day institution, facilitator, place, or technology salesman. Outside of the running world (which belongs to Pete), it’s our world (and also the world of the hummingbird, butterfly, flower, sun dried tomato, and other such niceties and even not so niceties), and we all live in it. Shaka.
Posted in General, Library Management, Technology, Uncategorized
Leave a comment
The Data Dude – Virtual Visits (Revised)
 Shaka. Last week, I blogged about a new element on the public library survey asking you to report virtual library visits, and the definition I posted has been revised (and hopefully will provide some clarity). I’ve worked it over, and the revised language is below. For those of you that provided feedback, thank you! I hope to clear up the confusion in this post today, and will revise the earlier post to reflect the change in the question definition. I apologize for the confusion. Keep in mind that this is not a federally required question. If it is difficult or impossible for you to collect this data, you are free to enter a 0. However, my earlier blog post provided the background on why state data coordinators (SDC’s) believe collecting this data is important.
What we are trying to do is to capture the number of unique visitors to your website for a sample time period (each day), and then obtain an annual figure based on that sample. Now, what is a unique visitor? In short, if you have one person (as determined by their IP address) who accesses your website numerous times in one day, say 10 times, you count them once (even though they had 10 “user sessions”). If they come back tomorrow and do the same thing, count them again for that day. So every day, you start over with a new count of unique visitors to your site during the sample time period. You collect the number of unique visitors for a time period, for example, a month or “typical week”. If you’ve collected the data for a week, multiply by 52 for an annual figure, or if you’ve collected it for a month, multiply by 12. The goal here is to provide a decent balance and provide counts that are comparable to how you capture physical visits (or gate counts).
Here is the revised definition:
6.18. Total Annual Number of Virtual Library Visits to Library Website: Unique visitors is the number of inferred individual people as determined by IP address (filtered for spiders and robots), within a designated reporting timeframe (each day), with activity consisting of one or more visits to a site. Each individual is counted only once in the unique visitor measure for the reporting period, in this case, each day. The number of annual virtual visits can be calculated by summing the number of unique visitors each day for a one month time period. You may also report an annual figure based on a “typical week” (see definition below). Multiply by 52 weeks for an estimated annual total. A “typical week” is a week that is neither unusually busy nor unusually slow. Avoid holiday times, vacation periods for key staff, or days when unusual events are taking place in the community or the library. Choose a week in which the library is open its regular hours. Include seven consecutive calendar days, from Sunday through Saturday (or whenever the library is usually open).
The Data Dude – Virtual Library Visits
In keeping with the theme of announcing new questions or changes to the annual public library survey, today will focus on what we call the virtual library visit. But first, the Dude must retract what has been previously written about the -1. While the -1 is code for “not collected” on your surveys when the data is submitted to IMLS/Census, a recent conversation with the Bibliostat people indicated that they prefer that you enter N/A if data is not collected. If the survey question is not coded to accept letters (only numbers), then enter a 0. They will then change the field to -1 when they compile the data. Sorry for the confusion.
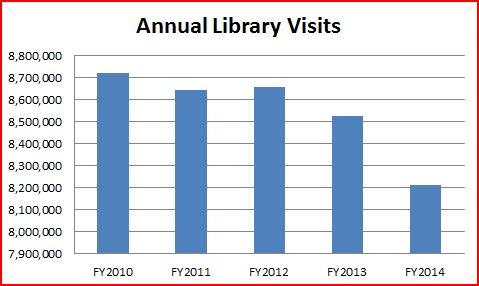
OK, on to the virtual library visit. Some of the reasons for collecting library statistics from the annual public library survey include identifying trends and demonstrating the value of public libraries. The chart to the right shows the number of annual visits to Nebraska libraries from 2010 – 2014, and while it looks like there is a huge drop between FY2013 and FY2014, keep in mind that this is in millions, so the actual change isn’t really that drastic. But physical visits to Nebraska libraries have been declining. The question then is what about people who use library services remotely or who are “virtual visitors”. One example might be the person who wants to read a book but doesn’t feel like driving all the way to the library. They might download an eBook. What about the guy who streams a video from Hoopla from his home with the help of his library card? These are examples of a library providing a service without the person ever visiting the physical space. Another example might be the person who browses the library catalog from home, places a hold on an item, and then picks the item up. Before the availability of the virtual library visit, this person would need to go to the physical library, search the catalog, and if the item was not available place the hold from the library for a later pick up. Score: 2 physical visits in the old day, 1 physical visit in the new day. But the new day is equalized if we count the person’s website visit as a “virtual visit”, which is the idea behind capturing this data.
Many states are already collecting this data. Our question definition is modeled after theirs. It seems that the most difficult question (where states differ) is whether or not to count virtual visits from within the library (e.g. staff and computer lab hits). Our question doesn’t specifically say to exclude them. Mostly, the reason for this is that from a technological standpoint, it may be much harder to exclude them, especially for smaller libraries with limited IT departments. For those Nebraska libraries that are hosted by the Commission, our comp. team intends to prefill this data for you. Again, if you don’t collect the data or an estimate is not available, feel free to enter N/A (not -1). Here is the definition as it will appear on the survey:
6.18. Total Annual Number of Virtual Visits to Library’s Website: Virtual visits is the number of inferred individual people as determined by IP address (filtered for spiders and robots), within the reporting timeframe, with activity consisting of one or more visits to the library’s website. The number of unique visitors to the library’s website may be calculated by summing the number of unique visitors for each month to obtain an annual figure. A visit ends when someone closes their browser or stops loading web pages on a website for a period of time (typically when more than 30 minutes elapses between page views).
Shaka.
Posted in General, Library Management, Technology, Uncategorized
2 Comments
The Data Dude – Reporting Electronic Stuff Pt. 2
 Last week we looked at reporting electronic stuff (mostly eBooks and Audiobooks) on the annual public library survey. This week will focus on one particular aspect of that, called electronic collections. Now historically the public library survey has had questions about databases. These include the databases provided by the Library Commission (NebraskAccess) and any databases offered locally by the library. So first off, what is a database? Well, a database is generally an electronic (online these days) catalog or index that contains information about published items, and in most (but not all) cases, the items themselves. This might include journal articles, magazines, newspapers, reference information (including images and video), books, or other documents (e.g. the historical Census records from the My Heritage database on NebraskAccess would be an example).
Now, the intent of some state data coordinators (SDC’s) was to broaden this definition a bit to include things that might not technically fit into the historical database mold, but don’t necessarily fit anywhere else either. These include things like Freegal, Zinio, Mango Languages, TumbleBooks, Tutor.com, and many many others. So someone proposed changing the definition from “database” to the broader “electronic collection” (although arguably these could all fall under the database umbrella, and many SDC’s make the argument both ways), and then capturing the number of times the electronic collection is used. Oddly, the SDC’s voted to change the definition of a database to the broader electronic collection, but not to capture or report the number of uses. To the Dude, it doesn’t matter much if you call it a database, electronic collection, or a duck, the real question is what is it and whether or not it is valuable. It also might be useful to know what kind of duck or ducks they have next door, in case you want to avoid duplicating the Joneses, or just want to keep up with them.
To the Dude (and on the state level), it seems important to know what databases…ahem, electronic collections, that libraries subscribe to, and to know how many times they might be used. When looking at something like Freegal or Zinio, the number of uses seems simple – each downloaded item counts as a single use. It gets much more complicated when discussing other electronic collections such as Ebsco or Mango Languages, because you don’t want to count each search as a use. It seems more relevant to count each log-in as a session. Someone logs in for a half-hour to work on Mango Languages? Count it as one use. Someone spends an hour on Ebsco, count it as a use. Well, technically and if possible from the reporting scheme, you could count each article downloaded as a use. 1 download = 1 use. If you count the download as a use, don’t double count the session as a use.
So this year, while you will report the number of local electronic collections (and we will prefill the number available via NebraskAccess) there will be a question that asks to list the names of the electronic collections you subscribe to. Note that you don’t include collections that are freely available on the web. There will be an optional question that will allow you to report the number of uses. This will be set up as a “repeating group”. In other words, you can enter “Zinio” for the electronic collection and then enter the number of times it was used. Next, you can add another electronic collection (group) and the number of uses. If you don’t have the data for the number of uses, you can just list the database titles (e.g. Zinio, Mango Langauges, Tutor.com, etc.). You could also enter the number of uses for one but not another (e.g. Freegal may be easier to report useage than Ebsco). Now, don’t get bent out of shape, the number of uses is optional. If you don’t know or you didn’t collect the data, enter N/A and a note in the note field that says “not collected” or “data not available”.
You should note that this applies to things that are kept by the library patron. Things that are returned (e.g. eBooks that are “returned”) are reported in a different area, covered in last week’s blog post, Reporting Electronic Stuff Pt. 1. Shaka.
The Data Dude – Reporting Electronic Stuff Pt. 1
One of the difficult parts of the annual public library survey has not just been what to count, but where to report what is counted. This is true for reporting revenue, expenditures, staffing, and other things, but the focus here today is where to count electronic stuff. While it is relatively easy to count print materials (books and serials), audio physical materials (CD’s and playaways), and video physical materials (DVD’s or VHS for the old skoolers), counting the downloadable versions of those items and other electronic things becomes a bit trickier.
More and more often libraries are offering online access to things, including language and other educational courses, music and video downloads, downloadable magazines, and others. Now, when considering reporting these types of things, the key element here is to first ask this question: Is the electronic stuff checked out and returned (even if the return is that it magically disappears from your device after a set checkout period)? If so, then most of the time these are reported under one of three holdings categories on the survey: (1) eBooks; (2) Audio Downloadable Units; or (3) Video Downloadable Units. These are all reported on your survey in section 4, Library Services. The kicker here is that if you report these electronic items in the holdings part of the survey (section 4), you also need to report the number of times they are used (circulation), in section 5, Library Services, and vice versa. This represents a slight change in the data element definition in previous years, due to a vote by state data coordinators. Example: You report x number of OverDrive holdings, and x number of circulations. It gets tricky when we consider content that has a set circulation period but the library doesn’t select the items available to the user. Hoopla would be a good example of this, where the library pays for access to the vast quantity of items in the Hoopla collection, and then pays per item downloaded by the patron. The patron selects the item they want to read, watch, or listen to. This is well known as “patron driven acquisition”, and makes sense in that the library isn’t purchasing things that might sit on the shelf collecting dust or just infrequently used. Now for these things, reporting holdings is a bit tricky because even though the user may have access to millions of items, the library only pays for items that are downloaded or used. In this case, the holdings information can be reported in a reverse-engineered fashion based on the number of uses. You have 10,000 eBooks downloaded in the FY (out of 1.2 million available)? You report 10,000 eBooks held, and 10,000 uses. The Dude doesn’t know any other way to report this. Keep in mind that the important number here is the uses, so don’t get too caught up on the holdings reporting. And this only applies to things that circulate all the way around (e.g. are “returned”)
This post is part 1 of reporting electronic stuff. Part 2 will explain the data element changes for databases, which have been re-named “electronic collections”. Shaka.
The Data Dude – Wednesday Watch: John Adams
 On July 4 in the Dude’s neighborhood, stepping onto the back deck after dark is like stepping onto the set of Apocalypse Now. Every year the Dude goes through this and also uses the time as a friendly reminder to rethink American history. This includes (but is not limited to) such things as the revolutionary war, current events, U.S. Presidents, and of course Native Americans. The Native American part is timely, as the Dude travelled to South Dakota this summer with his two kids for a week long excursion into the hills. It is an oversimplification, but perhaps the notion of early patriotism and American history should always be viewed under the shroud of Native American history. The Dude is in the process of re-watching the excellent PBS series We Shall Remain, a highly recommended tool to help understand early American history from the Native perspective. One word about Mount Rushmore: Its original condition, well known to the Lakota Sioux as Six Grandfathers (yes, the white Dudes renamed it) is spectacular. Unfortunately, there are few photos before it was taken from the Lakota Sioux and carved up, but here is one.
Speaking of July 4 (the Dude will return to the Native tangent later), what about July 2? On July 3, 1776, John Adams wrote a letter to his wife Abigail, about the historical significance of July 2:
“But the Day is past. The Second Day of July 1776, will be the most memorable Epocha, in the History of America. I am apt to believe that it will be celebrated, by succeeding Generations, as the great anniversary Festival. It ought to be commemorated, as the Day of Deliverance by solemn Acts of Devotion to God Almighty. It ought to be solemnized with Pomp and Parade, with Shews, Games, Sports, Guns, Bells, Bonfires and Illuminations from one End of this Continent to the other from this Time forward forever more.”
Many of you may know about the July 2/July 4 confusion, mostly created as a result of John Trumbull’s infamous painting in the U.S. Capitol Rotunda (and also on the back of the $2 bill), Declaration of Independence. The problem with the well-known painting is that it seems to suggest that the Continental Congress event took place on July 4 instead of July 2, and that there was a meeting of the minds and grand signing ceremony on that day. it didn’t happen like that. While the meeting of the minds part (and the vote for independence) took place on July 2, the document itself was revised a bit and finished with a July 4 date, and then sent to the printer. Most of the Independence Dudes skedaddled back home and actually signed the finished Declaration on August 2.
Out of the first 12 Presidents, Adams and Quincy Adams were the only 2 Dudes that not only did not own slaves, but were outspoken against slavery. Washington, for the record, spoke out against slavery, but that apparently didn’t keep him from owning them. But we need to not lose touch with the fact that both Adams and Qunicy Adams were politicians, and should judge accordingly. Also, we need to understand the dynamic between the Colonists and Native Americans. There is little that has been written about the views of Adams when it comes to Native Americans, and little written by Adams himself on the subject. While the Dude would like to speculate that the likes of Adams, Washington et. al. would be appalled at the trail of genocide, broken treaties, and overall lousy treatment of the Native Peoples, the reality is that there is a deep history and support of Native American discrimination, dispossession, and stereotypes (the Declaration of Independence, authored mostly by Jefferson, Adams, and Franklin, includes the phrase “merciless Indian Savages”) that still continues today. Suffice it to say that a balanced view of history is a cogent prescription when it comes to Native Americans. An example of balance might include the Native American art of David Behrens. One of his paintings, an antithesis to Mount Rushmore, is entitled Founding Fathers, a depiction of Chief Joseph, Sitting Bull, Geronimo, and Red Cloud. Alas, this is a tangent that the Dude often goes down, but in this case worth mentioning for the big picture.
Given the Dude’s penchant for often preferring the film or miniseries over the book (although my most recent example of the opposite is evidenced by the lackluster film version of (yawn) Unbroken), most of you know (in case you missed it in the title) that the Dude is through the detours and headed toward the HBO miniseries John Adams for today’s Wednesday Watch.
John Adams is a 7 part series roughly covering 1770-1826, or the time period from the Boston massacre to the death of Adams (ironically on July 4, 1826, the same day that his rival turned pen pal Thomas Jefferson died). According to WorldCat, there are 18 public libraries in Nebraska that have John Adams. The look and feel of the series seems historically accurate. This includes the colonial clothing, characters (Washington, Franklin, Hancock, Hamilton, et. al.), buildings, speech, and the like. The Dude was at first skeptical of actor Paul Giamatti’s depiction of Adams, but by the end of the first episode concluded that Giamatti (the pinot noir wine snob from Sideways) was a good choice. You need to keep in mind that there may be some editorial license taken with the series (it is TV), but there are many historical accuracies and many things to like about it. An example is that it doesn’t sugarcoat the family struggles and dynamic of the Adams family, including John’s absences and Abigail’s difficulties at home. This includes the alcoholism, financial struggles, and premature death of their second son Charles Adams.
Now, if you are looking for a more in depth analysis of the politics or something that has 100% accuracy (if there is such a thing), then you probably want to delve deeper somewhere else. But for understanding the basics (in an easy to digest format) of not only Adams but also many things about the American revolution that you might not have already known, this is a very good start. Some things the Dude wasn’t aware of include the fact that attorney John Adams not only represented the British soldiers charged with murder in the Boston massacre, but got them acquitted. While the portrayal of Samuel Adams (no relation to the beer) as Sonny Corleone-ish seems a bit off (although it adds to the drama), there is much to like with this series. Finally, the Dude would like to thank HBO, who not only responded (the same day no less) to e-mail requests to use the cover art in this and other Wednesday Watch posts, but granted permission. Shaka, HBO.
Posted in General, Uncategorized
Leave a comment
The Data Dude – Early Literacy
 Believe it or not, the Dude is working on next year’s public library survey, scheduled to launch around mid-November, 2015. And to those of you who I promised no major changes, I apologize. There will be changes and some will be major. Some will be minor. Before you get bent out of shape, let me explain that some of the major changes will be for the better; clarifying some things that were difficult to understand in the past, pre-filling more data to help you with the survey, and hopefully make your life a bit easier during survey time. For today’s post, the focus is something the Dude read on early literacy; specifically the well known library program called 1,000 Books Before Kindergarten. Many Nebraska libraries offer this program. It’s generally thought to be a passive library program, but nonetheless, you can count it as a children’s program on your survey. If you are looking for more information about the program, read this article about three-year olds Gidget and Jaycee Crocker, from McCook, Nebraska. Most would agree that these are good programs, helping to promote early literacy and familial connections. However, we have no data on these types of early literacy programs. On the next survey, you will be asked how many children’s programs are specifically focused on early learning and literacy (pre-K)? And remember, while we would like you to collect and report the data, if you simply don’t have it this year because you have not yet implemented a mechanism for counting, you can look to the minus 1 (-1), which is entered when the data is not available or not collected. Now, as the Dude pointed out before, the minus 1 isn’t always the desired answer, but sometimes it is the best one. Shaka.
Posted in General, Information Resources, Library Management, Uncategorized
1 Comment
The Data Dude – IMLS Compare Tool
IMLS has recently updated the Compare Public Libraries and Search for Public Libraries tools with FY 2013 data. If you are looking for Nebraska library data, the best place is on the NLC website, in the data services section. Those statistical reports are available back to 1999. However, you might think that the Compare tool is a bit less relevant because it has FY 2013 data instead of the FY2014 Nebraska data. Keep in mind that IMLS has different groups of states that have different public library survey submission dates (so that all 50 states – plus U.S. territories) aren’t being submitted at the same time. The Compare tool is a great tool. It is easy to learn how to use and navigate just by operating it. One thing of importance is that this tool is valuable to identify your national peers. The Compare tool allows you to generate a report based on the factors reported in the survey, but one important one is the legal service population (LSA) of your library. To do this, first begin your search by finding your library. Next, click on “Choose Similar Libraries (Comparison Group) by Variable”. You can select any variable, but if you want LSA, click on the + sign next to Organizational Characteristics, then Population of Legal Service Area. I like Method 1, which defaults to 20%, but depending on your library a more realistic percentage is 5% or 3%. The Compare tool will then tell you how many libraries are in your comparison group. You can either add another variable, or if you just want the data for those libraries, click on Continue. On the next screen, expand each category you want data for (or you can select all of them). You can then look at the data from the libraries in your comparison group, or export it to an excel file from the link at the top. Shaka.
Friday Reads: Big Bad Love by Larry Brown
 Two of my favorite authors are Raymond Carver and Charles Bukowski. Both are blue collar writers who encapsulate the mundane, disturbing, hapless, and tragic parts of everyday lives. Often, there is a great deal of humor underneath or simultaneously with these tragedies. Until recently, I had no idea that there is a term for this style and type of writing. It’s called “dirty realism.” The writing focuses more on the pain and suffering rather than the warm and fuzzy; the unhappiness rather than the happy; the trivial rather than the substantive. Both Carver and Bukowski have a very distinctive L.A. feel; although Bukowski was more skid row than Carver. Listen to some Tom Waits while you read either and you’ll feel right at home (I’d recommend Frank’s Wild Years and/or Swordfishtrombones). Now, before I get to rambling (or to put an end to it here and now), this Friday Reads isn’t about Carver or Bukowski. The problem is that I’ve already read their stuff (they are both dead), and for years have been searching for something with a similar feel. I finally found it when I discovered Larry Brown. Unfortunately, Larry Brown also died in 2004, but since I have yet to read any of his stuff, I feel refreshed. Well, sort of.
Like much (if not all) of Carver’s work, Larry Brown’s Big Bad Love is a collection of short stories. There are similarities, but Brown lived in Oxford, Mississippi, so the stories have a different, non-California feel to them. The stories are written from a male perspective, filled with alcoholics, depression, and tales of dysfunctional or failed relationships. I found the stores to be relatable (on some levels) and often hilarious. There is, however, a fine line between laughing at another’s misery and laughing with them. I had the latter feeling. There is something to say about retaining your sense of humor during life’s tragedies, and I think Brown aptly captures that, at least in part 1. Part 2 of the book consists of a longer story. I wouldn’t even recommend reading it. Compared to part 1, it’s a bore. Here’s a quote from part 1 that provides a snippet of Brown’s style:
“I didn’t know why something that started off feeling so good had to wind up feeling so bad. Love was a big word and it covered a lot of territory. You could spend your whole life chasing after it and wind up with nothing, be an old bitter guy with long nose hair and ear hair and no teeth, hanging out in bars, looking for somebody your age, but the chances of success went down then. After a while you got too many strikes against you.”
The Data Dude – Robots in the Library Makerspace
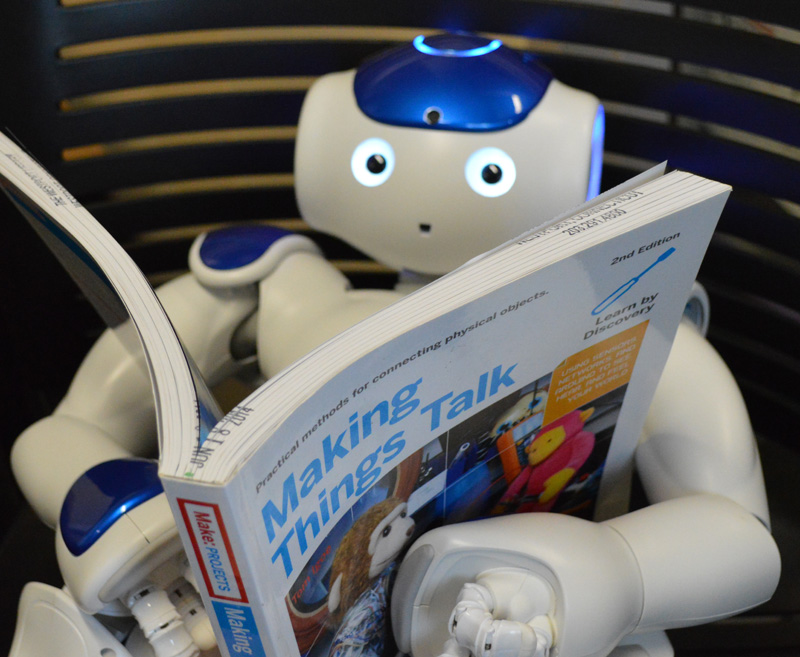 The Dude has been on vacation (and after travelling with two kids ages 4 and 8, discovered that there are some pretty decent shows on Cartoon Network—favorites include Uncle Grandpa, the Regular Show, Steven Universe, and Teen Titans Go!), but wanted to share an article about the Westport Public Library in Westport, Connecticut. Two things caught the Dude’s attention: (1) The robust makerspace at this library – specifically, the acquisition and availability of robots; and (2) the possibilities for programming these robots, as evidenced by their Tai Chi demonstration. For the record, the Dude is a student of Chen style Tai Chi; it looks like the robots are programmed to do some type of Yang style. It’s not that one is necessarily better than the other, but there are differences. Nonetheless, it interestingly illustrates what can be done in this library’s makerspace. The draw to the robots is similar to the idea of libraries offering the CoderDojo, except in this instance you are programming the robot and not websites, games, and apps. These robots can speak 19 different languages. If you are considering expanding your makerspace offerings, check out the makerspace section of Westport’s website, complete with videos and a blog. Shaka.
Photo courtesy of Westport Public Library, Westport, CT.
The Data Dude – Wednesday Watch – Rectify
![]() Recently, one of the Dude’s colleagues here at the Commission conveyed a quote from Oscar Aviles, the warden for the Hudson County, NJ jail. Warden Aviles used to believe that his job was limited to keeping the jail safe; regarding rehabilitation and re-entry programs for inmates, he said: “That’s not my problem. This is somebody else’s problem.” He no longer thinks this way. In other institutions, the end of this line of thinking is long overdue. The Dude thinks libraries have the potential to play a large and important role in that (and are often underutilized by administrators).
Recently, one of the Dude’s colleagues here at the Commission conveyed a quote from Oscar Aviles, the warden for the Hudson County, NJ jail. Warden Aviles used to believe that his job was limited to keeping the jail safe; regarding rehabilitation and re-entry programs for inmates, he said: “That’s not my problem. This is somebody else’s problem.” He no longer thinks this way. In other institutions, the end of this line of thinking is long overdue. The Dude thinks libraries have the potential to play a large and important role in that (and are often underutilized by administrators).
Those of you who know the Dude are aware that he used to work in a correctional facility library. During the time there, the Dude had an inmate who worked with him for almost the entire 9 years. This particular guy told the Dude about an original series show on Sundance TV (owned by AMC Networks) called Rectify. Now, don’t get this confused with Justify. The sound alike, but are two entirely different animals. Justify is a show on FX starring Timothy Olyphant (who also played Sheriff Seth Bullock in the fantastic HBO series Deadwood). In Justify, Olyphant plays Raylan Givens, a no-nonsense U.S. Marshall who returns to his hometown in Kentucky. It’s a sound series, but today’s column is about Rectify. Anyway, this particular inmate told the Dude that by far Rectify absolutely nails the feeling that a person has when they are released from prison. The story of Rectify begins with the main character, Daniel Holden (played by Aden Young) being released from Georgia’s death row after 19 years. He went to death row at the age of 18 for the rape and murder of his 16 year old girlfriend. He confessed to the crime, but there is a lot of doubt about whether or not the confession was coerced. DNA evidence frees him from death row, but it doesn’t necessarily exonerate him. Many in the local community still believe he is guilty, and as the viewer, we really don’t know (at least after two seasons). The first six episodes cover the first six days after his release from prison. Flashbacks tell part of the story of the days during his incarceration. The main thing about Rectify, the thing that the inmate who worked with me in the library wanted to convey, is that it appropriately captures some of the experiences and struggles of prison life, and also the huge challenges of transition back into society (especially after being locked up for 19 years). The subplot (although as the series develops it becomes more and more relevant) is finding out what actually happened on the night of the murder, and the depth of the involvement of the main character, Daniel Holden. But that really is a subplot, at least in the first two seasons.
You might look at the summary of Rectify and believe it’s just another ho-hum cliché of whodunnit, but it is really much more than that. Both season 1 and season 2 are available on DVD. Season 3 is scheduled to begin on July 9, 2015. Since the Dude has no cable, he will need to wait for the DVD or the Netflix streams to get caught up with season 3. According to Firstsearch, no Nebraska libraries (that’s zero, nada) have Rectify on DVD. A number of libraries in neighboring states have it, however, and 289 libraries worldwide. Shaka.
Posted in General, Library Management, Uncategorized
Leave a comment
The Data Dude – The Power of the -1
As some of you know, the Dude is working to clear up some of the questions that the Census folks have regarding our submitted public library survey data. You may have received a phone call or e-mail with questions about your survey. If you don’t care about the process, skip to the second paragraph below. If you do, read on. As a matter of explanation, IMLS (the Institute of Museum and Library Services) is the agency that oversees the public library survey. The U.S. Census Bureau is the agency that works for IMLS to collect the data. Individual libraries in Nebraska submit their survey data online via Bibliostat (there are other methods, but we use Bibliostat), between the middle of November and the middle of February. Bibliostat has edit checks built into the program to flag certain questions (e.g. if there was a large change from last year), and in order to pass the edit check you need to explain the differences in a note. Once your surveys are submitted, they are reviewed and you might be contacted by the Dude if there are additional questions. Once that is cleared up and all of the surveys are submitted, finalized, and locked, Bibliostat sends us the files of the compiled data and we submit them to Census. When the data goes to Census, there are additional edit checks (both critical and non-critical) that we must pass in order to submit the data. Once that occurs, Census looks over everything and then sends us another file with follow up questions. Generally, this is because there are inconsistencies in the notes that explain the inconsistencies in the data.
UPDATE: Throughout this process, you should be reminded of the codes that Bibliostat and Census use for data that is reported. Now, these codes are -3 (not applicable), -1 (not collected), and just plain ol’ 0. The Dude had previously reported using these codes in your surveys, but was recently told by Bibliostat that they prefer either N/A or 0. They then convert those entries to either -1’s or -3’s for the federal elements. The Dude does ask that for these you include a note indication “not collected” if the question is relevant but you just didn’t collect the data. Shaka.

