
Search the Blog
Categories
- Books & Reading
- Broadband Buzz
- Census
- Education & Training
- General
- Grants
- Information Resources
- Library Management
- Nebraska Center for the Book
- Nebraska Memories
- Now hiring @ your library
- Preservation
- Pretty Sweet Tech
- Programming
- Public Library Boards of Trustees
- Public Relations
- Talking Book & Braille Service (TBBS)
- Technology
- Uncategorized
- What's Up Doc / Govdocs
- Youth Services
Archives
Subscribe
Author Archives: Sam Shaw
The Data Dude: Public Library Survey Reminder
 Shaka. It is getting close to crunch time for the annual IMLS Public Library Survey. The deadline is February 19, 2016, a mere 9 days away. The Bibliostat Collect portion of the data services section of the NLC website has a link to the login, instructions, tips, and other tidbits to help you complete the survey. Keep in mind that the survey is required for your library to receive state aid if you are accredited. If you aren’t accredited, you still have an incentive to complete the survey ($200), called Dollar$ for Data.
As of yesterday, our response rates are still pretty low. If you run into a bind and have special circumstances, please let me know. I am here to help you with the process in any way I can. Don’t hesitate to contact me. Thank you in advance for your participation and patience.
Posted in General, Library Management, Uncategorized
Leave a comment
The Data Dude on Almost Constant Online Use
 The Dude is hard at work reviewing surveys and like many of you is starting to suffer from data drudgery (a/k/a the DD’s). Thanks to all of you who are working on getting your survey submitted. Because of this, today’s post will regurgitate a recent report from the Pew Research Center. The title of the report says it all: One-fifth of Americans report going online ‘almost constantly’ (and nothing illustrates this more than a frog in a shopping cart next to a 1980’s PC). If you want a further breakdown of the demographics of these online addictions, take a closer look at the report. This is the first time that Pew included an “almost constantly” option on a survey. One of the takeaways from this is that in light of the “almost constantly” possibility, if you are either promoting your library or running your business (or running your library like a business) then you’d be better served to take things into account like the use of mobile devices and social media when you design your websites and promote your services. Because 20% of Americans are on those things “almost constantly”. Let your imagination guide you when considering that 20% and how that “almost constant” affects their daily lives.
And speaking of running things like a business (so much for that promise for a simple regurgitation), perhaps let’s clarify that and say let’s run things like a progressive 22nd Century business where the primary (or sole) focus isn’t just on maximizing profits at any cost. Profits aren’t everything, especially when real lives are trounced in the process. Try an empathetic business model, where all people (from the janitor to the department head) are treated with respect and valued. Trust me, you will feel much better when you choose quality over quantity, and they will too.
Another takeaway from this is the notion of being constantly connected and specific connections to social media. An extensive study, specifically about unrestrained Facebook use and subjective well-being was published not too long ago (2013). In case you can’t see this one coming, yes, what they discovered was that as FB use went up, life satisfaction went down. Two things should be noted, however. For one, we are talking about excessive use, and quite frankly this goes with the “almost constantly” theme of this post. Secondly, the researchers also asked questions about their perceived subjective well-being when they didn’t uncontrollably use FB but rather sought out direct social interactions with real life humans. Guess what? When the subjects had more direct social interactions and less online ones, they reported feeling better over time.
One point to mention here is to not underestimate the importance of a digital detox and reiterate the importance of moderation. First, the detox. Start today. You don’t have to go on a vacation to Angkor Wat or the North Shore of Oahu to make this happen. Disconnect to connect, so to speak, with real people. They are in front of you every day. Now, the Dude won’t get upset if you don’t; some people need a little alone time and that’s OK. Completely understandable. But there are times when you really don’t need to reach for that phone, tablet, or laptop. It can wait a little while later. Finally, the basic prescription here is good old fashioned hedonism. No, not the hedonism you’ve come to think of (such as Roman World from Westworld), but rather the prescription that we take into account both pleasure and pain. Maximize the pleasure, minimize the pain. Familiarize yourself with Bentham’s Hedonistic Calculus (or Felicific Calculus, if you prefer). Notably, while we are at it (and Bentham recognized this), let’s take into account the pleasure and pain of other people. It’s a complicated world but we all live in it. Let’s close with a quote from the Dali Lama that seems to transcend these notions:
Western civilization’s science and technology bring society tremendous benefit. Yet, due to highly developed technology, we also have more anxiety and more fear. I always feel that mental development and material development must be well-balanced, so that together they may make a more human world. If we lose human values and human beings become part of a machine, there is no freedom from pain and pleasure. Without freedom from pain and pleasure, it is very difficult to demarcate between right and wrong. The subjects of pain and pleasure naturally involve feeling, mind, and consciousness.
Shaka, Dali Lama.
Posted in General, Information Resources, Technology, Uncategorized
Leave a comment
The Data Dude – Wednesday Watch: Twin Peaks
 In case you hadn’t heard, Showtime has announced a nine-episode revival of the Twin Peaks series that originally aired on ABC from 1990 to 1991. For those of you who are older, the mention of Twin Peaks conjures up the memory of the quirky TV show and not a symbol representing objectified women, inauspicious food (that’s an assumption since the Dude has no firsthand knowledge), and Sons of Anarchy posers flexing their biceps and engaging in fracases (or is it fracai?). Yes, youngsters, there is another Twin Peaks, one that existed before the name was soiled by yet another franchise that the world really does not need. This one is much more tolerant, much more haunting, and with much more enigma and intrigue. The Showtime episodes, set to take place 25 years after the original series ended, will be written by creators David Lynch and Mark Frost (Lynch temporarily bailed on it because of Showtime’s lack of support, but he got his way in the end). In Nebraska, only a couple of public libraries own the Twin Peaks DVD’s (the series lasted two seasons; the gold box edition contains all of them). For those of you who are fans, it might be time to revisit before the Showtime continuation airs; for those who have never heard of the Twin Peaks series, it is worthy of a thumbs up on today’s Wednesday Watch.
Twin Peaks has a bit of everything. Old fashioned mystery, humor (mostly dark), horror (it will likely cause you to look over your shoulder at times), offbeat-ness, huge amounts of characters that are difficult to keep track of (diagrams of how characters are interconnected is almost reminiscent of Hegel’s dialectic), complex plot lines, doppelgangers, ethereal music, and a gander into the paranormal or supernatural world. The original show aired a couple years before the X-Files, another show that has recently reappeared (and may be worth checking out), and with a number of similarities. One of the best parts of the show is main character FBI agent Dale Cooper (played by Kyle McLachlan), summed up by this blogger:
“I gotta say I was pretty psyched about Coop’s crime-fighting methods. Most case-solving on TV today relies heavily on Western science with microscopes, ‘enhanced’ security footage, and DNA. Coop solves murders by dreaming and throwing stuff. And no one seems to question him. Coop and Twin Peaks champion the belief that there are other ways of knowing beyond science …”
Nuff’ said. Shaka.
Posted in General, Uncategorized
Leave a comment
The Data Dude on Monotony
 Thanks goes out to all of you who are helping collect data, by completing our makerspace survey or working on your public library surveys. I know surveys sometimes can be a chore and/or a bore, so here’s to you for helping us in that regard. Recently, the Dude has been reflecting on the monotonous and repetitive nature of daily life (how’s that for a transition?). Between periods of boredom and emotional responses from other humans analogous to something out of the Twilight Zone, there is this notion of balance in life. Speaking of which, isn’t that a concept that leaves a sour taste in one’s mouth? Balance, that is. It implies that we joggle all these sets of circumstances in our lives, and one circumstance seems to be necessary in order to obtain the other. The implication is that the monotonous work feeds the ability for leisure (or at least less monotonous work). The Dude sees this monotony almost every day, when encountering the same strangers in the same places doing the same things (that’s the Twilight Zone reference, but maybe Black Mirror is more appropriate since technology is often a part of it). Well, the Dude says toss balance out in the toter. Change your line of thought so that it is no longer necessary. But before you do so, know that once in a while, something or someone appears that changes the game, surprises you, and perhaps does not completely eradicate the monotonous feelings but somehow adds some meaning, passion, or purpose. Make sure that if that happens, you don’t miss it. Irish poet John O’Donohue (Eternal Echoes: Celtic Reflections on Our Yearning to Belong) aptly sums part of this up:
“We live in a world that responds to our longing; it is a place where the echoes always return, even if sometimes slowly… The hunger to belong is at the heart of our nature. Cut off from others, we atrophy and turn in on ourselves. The sense of belonging is the natural balance of our lives… There is some innocent childlike side to the human heart that is always deeply hurt when we are excluded… When we become isolated, we are prone to being damaged; our minds lose their flexibility and natural kindness; we become vulnerable to fear and negativity.”
If you read that again, you’ll notice that this has the potential to tie into our notion of the library makerspace (although admittedly the Dude was thinking of something more along personal lines), or if you prefer, just scratch your head and move on. But since this blog should (at least in theory) have even a slight applicability towards something library related, let’s take a crack at it.
In response to the makerspace survey, some of you indicated that you were intrigued by the notion but either had limited experience with it or had no experience at all with the term. Well, fear not because that term captures many things (keep reading for more detailed information). Common terms for makerspaces often include hackerspaces, design centers, community collaboration areas, workshops, innovation space, and (the Dude’s favorite to date) creation stations (it conjures up a nostalgic feeling similar to that of Conjunction Junction, and the Dude has an affinity for nostalgic things). The common thread is that the space (often dedicated solely for such a purpose) offers people the ability (either individually or collectively) to come together and create something. Spaces often include all kinds of things or tools to create, and the sky is the limit on what might be offered. The survey contained some of the more common things that libraries, educational institutions, or communities might offer. Collaboration is, however, often an essential part of these spaces, as knowledge might be shared or ideas built upon during the creative process. And it makes sense for libraries to be involved with offering these things and programs. Libraries, in addition to being what one might call anchor institutions in communities (that’s a fancy way of saying they have been around for a long time and have always been and will continue to be there), are facilitators of the free exchange of knowledge and ideas. The makerspace embodies this notion.
Now back to O’Donohue. For the record, these feelings of monotony don’t permeate or consume a huge amount of my time, but they do exist. When we talk about a lot of these things, the notion of confidence comes into play. Now, I’ve blogged before about creative confidence, and that certainly is important. In the library sense, people who come together to collaborate on things (like in a makerspace) certainly need an amount of creative confidence in order to exchange ideas and build on someone else’s ideas. But I’m talking about confidence that gets a person in the door, or gets them to look someone else in the eye, or say hello. To a large and often underappreciated degree, this involves vulnerability, and that may be the topic of discussion on another day. Photo upper right is of the Metz Beer bottling plant, courtesy of Nebraska Memories. Shaka.
The Data Dude – Makerspace Survey
 Thanks to all of you who have responded to our recent survey on library makerspaces. In the first day alone, we received over 100 responses. The survey will stay open for a little while longer, so if you haven’t yet looked at it, there is still time. The survey is short; it should only take about 5-10 minutes to complete. Thank you in advance for your time and effort.
Here is a link to the survey.
Also, you have just over one month to complete your public library survey. Please contact me if you have questions about either survey. Shaka.
Posted in General, Library Management, Technology, Uncategorized
Leave a comment
The Data Dude: Public Library Survey
This is a friendly first of the year reminder to those who have yet to start or complete your IMLS Public Library Survey. The deadline is February 19, 2016. The survey is required for your library to receive state aid if you are accredited. If you aren’t accredited, you still have an incentive to complete the survey ($200), called Dollar$ for Data.
The link to log in to the survey is here. If you forgot your password, send me an e-mail and I will get it to you.
According to the last published statistics by IMLS, Nebraska was second to last (behind Puerto Rico) in response rates to the public library survey, so we need your help to improve our percentage. If you have any questions about the survey, or need any help, please contact me.
Posted in General, Library Management, Uncategorized
3 Comments
The Data Dude: Charts of 2015
 As 2015 comes to an end, it’s time to show some of the most misleading charts of the year. This serves multiple purposes; a bit of comic relief and to illustrate how a much more cogent display of the data would have looked (the link below shows both the misleading charts and then fixes to them). While the Dude would like to say that he compiled this list; instead kudos goes out to Keith Collins from Quartz, a digitally native news outlet. According to the Quartz website, they publish “bracingly creative and intelligent journalism with a broad worldview, built primarily for the devices closest at hand: tablets and mobile phones.” Keith’s article is called Axis of Evil: The most misleading charts of 2015, fixed. Shaka, Keith.
Posted in General, Library Management, Uncategorized
Leave a comment
The Data Dude: Digital Inclusion Survey Update
 Many of you are familiar or participated in last year’s digital inclusion survey. For those of you who might be new and have not heard about this, please check it out. Now the website can be a bit difficult to navigate, so let’s try and point out a couple of valuable things. While it is certainly encouraged to browse around the site, a good starting point is the interactive map. Recently, the digital inclusion people put a note towards the top of the mapping tool indicating a number of changes to the data, various “enhancements”, and the ability for you to update your own data. The easiest way to get started is to scroll down on the map page to the actual map, and directly above the map is a search box (called library lookup) for your library name (keep in mind that this is the name of the library, not necessarily your city). You can also use one of the draw tools to select a custom area on the map. Once you locate your library from the library lookup feature, the search will retrieve a map on the left and various folders on the right that summarize the following areas (with data pulled from census): Demographics, Economics, Education, Health, and Survey. While this is the same stuff you can get from Census, arguably this might be a more decent starting point or overview of data to better know your library service area. One other thing worth mentioning is that if you click on the map marker for your library you will get a pop-up that summaries the specific digital inclusion data for your library (or library branch). This includes the number of public access computers, broadband speed, technology services/resources, training, and programs/assistance. Underneath the google map photo on the left side of this pop-up, you can change the demographic radius (from 1, 3, 5, or 10 miles), export a summary profile of your library to a PDF (e.g. to hand out to board members, local policy makers, or members of the community), or edit your survey information. If things have changed, please update your information so that the maps are kept up to date. You can do this by clicking on the “Edit Branch & Survey Info” bar (again, just below the google map photo of your library, or the street in front of your library). Shaka.
The Data Dude – Wednesday Watch: Super Hero Squad Show
 Today’s Wednesday Watch will be about the animated Super Hero Squad Show. Depending on the season, 2-3 Nebraska libraries have the Super Hero Squad Show on DVD. The characters, a rather large collection of Marvel super heroes, are drawn in a mini-version, similar to that of Chibi (a style of Japanese anime where characters are drawn in child-like fashion with oversized heads). For lack of a more appropriate synonym, they are, well, kind of cute. The main characters all have their own little bits of quirkiness which makes the show worthwhile, transcending the same ol’ good fighting evil story. For example, suave Iron Man is complicated and tech-saavy, albeit a bit too impulsive; Hulk is simple minded, strong, and of course has anger management issues that affect the rest of the group; Silver Surfer, while an alien, talks quite like a stereotypical surfer; Thor speaks in an Olde English tongue; Wolverine likes it cold and uses his claws to carve topiaries, just like Edward Scissorhands; Ms. Marvel is strong but temperamental at times. Not to mention a whole host of supporting characters that appear, including the recurring villains. Stan Lee is the mayor of Super Hero City. In addition to Ms. Marvel, female characters are represented by Black Widow, Storm, the Wasp, Scarlet Witch, and others.
The side stories are what make the Super Hero Squad Show interesting. True, the way the characters are drawn is unique, but without a decent and creative storyline, this show would fail. It doesn’t, however (fail that is). The heroes do mundane things that one wouldn’t expect, such as engage in philosophical discussions, fight over the remote control, bicker about whom should clean things up (and household messes in general), and numerous references to pop culture. And those things are funny. Sure, there are juvenile potty type jokes, but nothing too over the top. If your library is looking for something to appeal to the young crowd that won’t be too tough on adults who might be sitting in, Super Hero Squad Show might fit the bill. Warning: the theme song will stick in your head, so watch out. Speaking of the theme song, a recurring notion that appears in the song and the show is the term “Hero Up!” Whenever the “squaddies” (that’s what they are called) are faced with an adverse situation or villainous infiltration, they use the phrase “It’s time to Hero Up!” If you watch the show enough, you may find this translate over to the other parts of your life. A few examples: Kids not motivated to clean their room? Tell them it’s time to Hero Up. Richard promised stats for the Dude last week but hasn’t gotten it done yet? Hey Richard: Time to Hero Up. You get the idea. Special thanks to the Shout! Factory folks for the permission to use the SHS cover art. Shaka.
Posted in General, Library Management, Uncategorized
Leave a comment
The Data Dude on Line Charts, Pt. 2
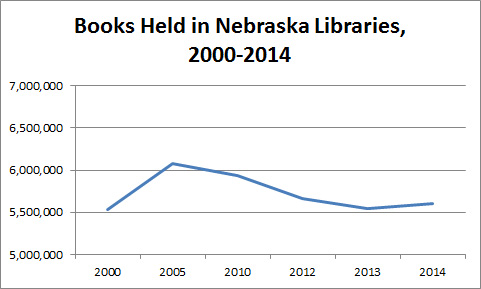
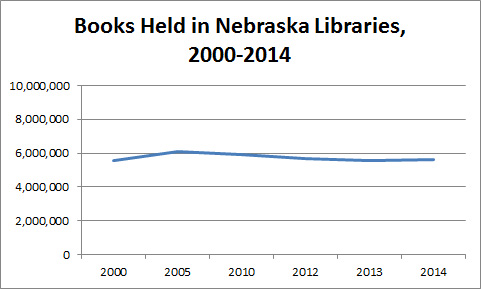
 Last week, in response to some data about paper book holdings in Nebraska libraries, the Dude asked the question: So what? Today will be an attempt to provide some context. If we look at the title to last week’s NET line graph, Bill Kelly added the following label to the top of the graph: SHELF LIFE: Fewer Library Books, and of course the assumption is that libraries have fewer paper books, presumably in response to less demand, and more eBooks. And over the time period in the NET graph (2010-2014) that’s true. But as was mentioned last week, if the data is expanded back to 2000, there was an actual increase of 1.19% in paper book holdings in Nebraska libraries during those 14 years, but the trend over the past few years is in fact lower amounts of physical items and increased amounts of electronic items in libraries.
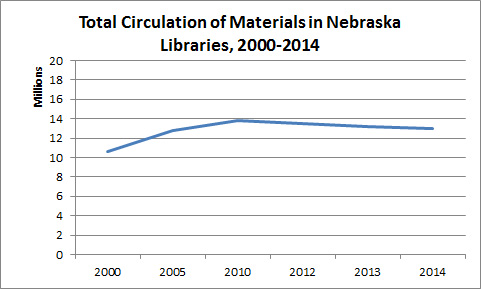
The eBook conundrum is a difficult one, and analyzing data for library holdings of eBooks is hard to illustrate. Why? Well, a few reasons, including the fact that eBooks aren’t technically purchased by libraries, they are leased. And those lease terms vary by publisher (both the duration and the price). Some publishers still don’t make electronic copies of their books available to libraries at all. Perhaps that is the deeper story to something like SHELF LIFE: Fewer Library Books; namely how the eBook lending platforms for libraries are much different than the traditional right of first sale traditional paper model. Notwithstanding all of this, it might be more productive to look at trends about the actual use of the items in the library collection. And even that might be misleading; a library could contain a bunch of crap that no one wants to check out, but for one reason or another has never been weeded. When a new go-getter takes over the library, perhaps all this lower demand stuff gets weeded and replaced with stuff that actually will be used. The end result to that would be lower numbers of paper books and VHS tapes (assuming those are the ones that would be weeded), and increased circulation of other things like light sabers and power tools. The chart, above right, demonstrates the total circulation of items in Nebraska over the last 14 years (incidentally, while the one above has the Y-axis at zero, it doesn’t look remarkably different when the Y-axis is started at 5 million).
The reality is that overall in the state, circulation of electronic items went up about 80% from 2012-2014, and circulation of physical items declined 6.42% during the same time period. Much of this is due to the fact that more libraries got involved in consortia (such as Nebraska OverDrive) that allowed more communities (and thus overall more people) to access materials. Keep in mind that, notwithstanding the recent decline of physical items held by Nebraska libraries, over 12 million physical items did circulate in 2014 (more than 15 times the number of electronic items used). Therefore, when looking at these numbers, many times the debate is framed as an either/or proposition when it comes to the physical and electronic in libraries (such as part 5 of the NET series – Will a Nebraska Community Tech Center Force Us To Consider Libraries Without Books?) and ultimately that’s probably not the question to ask (at least the data doesn’t support it).
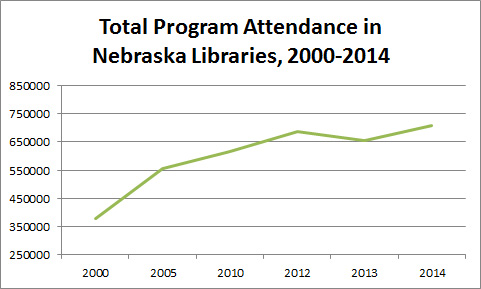
In actuality, libraries are offering new things and expanding services in addition to offering the traditional ones. As the chart second from the top illustrates, program attendance has gone up during the 2000-2014 time period. Additionally, the number of programs offered has risen at a rate fairly consistent with program attendance, and annual library visits have remained fairly steady for a number of years at around 8 million per year. The real questions (and the NET series tackled some of these) are how libraries are adapting to meet the needs of the community, by either expanding the offering of things in the collection, programs, and spaces (which admittedly is broad ranging, and could mean things like meeting rooms, community learning spaces, or collaborative makerspaces). And that is why the real question should be framed by an “and” instead of an “or”. Shaka.
The Data Dude on Line Charts, Pt. 1
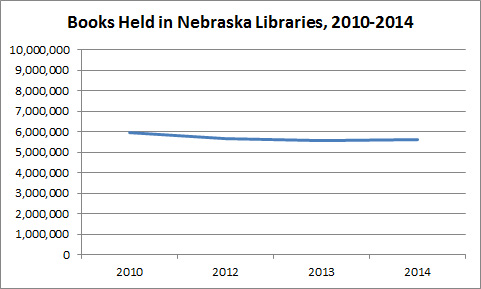
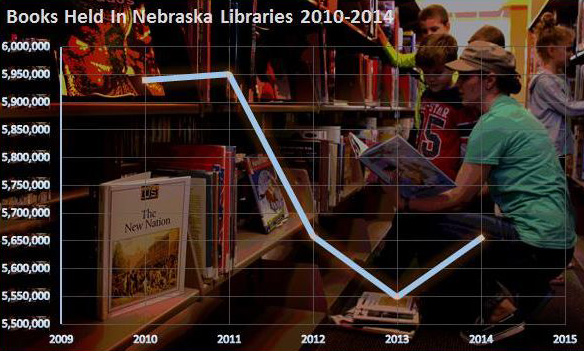
 Today’s post will focus on line charts (or graphs, if you prefer). The Dude thought about this in response to the graph (second from the top, on the right) that NET posted on its website to supplement the recent 5 part LIBRARIES: The Next Chapter series. At first, the Dude took note of the Y-axis of the NET chart (it’s the one with the books and readers in the background), remembering some rule that says to always start these charts (and bar charts for that matter) with 0. So today’s post will take a look at the line chart and axes, and next week’s post will most likely take a closer look at this data and something called context. Note that the data from these charts is from the annual public library survey.
In 1954, Darrell Huff wrote a book called How to Lie with Statistics. One of the main takeaways of Huff’s book is the notion that bar and line charts should always start the Y-axis with 0. Anything other than 0 is a fabrication or at least a misrepresentation, according to Huff. The Dude created the first chart, top right, which illustrates the same data that appears on the NET chart. The only difference is the Y-axis starting at zero on the top chart, and 5.5 million on the bottom chart. Both charts illustrate an overall decline of 5.67% in paper book holdings from 2010-2014, or a decline of 6.56% from 2010-2013, and an increase of .95% from 2013-2014. Taking into consideration the differences in both of these charts, which one is a better illustration of the data? Well, maybe neither one of them.
The Dude is a huge fan of data statistician Nathan Yau. If you haven’t seen some of his data visualizations on FlowingData, check them out. So for this general question, namely, should the Y-axis always start at zero, the Dude consulted Nathan Yau. Ironically, Nathan’s FlowingData website had a post on the main page about this very topic, and if you have a chance, the Vox video he links to in his article is well worth the two and a half minutes. The gist is that the Y-axis need not always be zero, but the most important thing, as the Vox video illustrates, is context.
Originally, the Dude admits that he thought that the NET chart misrepresented the decrease in paper books held by Nebraska libraries (by illustrating a much larger decrease than actually occurred), but isn’t the increase illustrated from 2013-2014 just as misleading, since it tends to show a sharp and somewhat dramatic increase from 2013-2014 when in actuality the figure is less than 1%? Also, does the first graph at the top fail, in that it doesn’t show any change at all, or very little? If we expand the data back to 2000, we get a different illustration of the trend (see third and fourth right, with two different Y-axes). The real question here, generally speaking, after looking at the data, is the greatest of all philosophical questions: So what? That’ll hopefully be the topic for next week. Shaka.
The Data Dude on Bibliostat Logins and Browsers
Shaka. As some of you are now working on your public library surveys via Bibliostat, you may be experiencing log-in or browser related issues. Nothing is more frustrating than this. Feel free to contact the Dude if you have problems and need some help. First, if you are unable to log in (after double checking your passwords), make sure that the zeros are zeros and not capital O’s. None of the passwords contain capital O’s; what you see are zeros. Another thing to double check is your number and caps locks (although Bibliostat isn’t case sensitive). Finally, you can type your ID/password in a word processor and then copy and paste. Sometimes this exposes the irregularity, which sometimes is due to typing and not being able to see the characters (because you see the *****).
Now for the browser blues. Rule #1: Don’t use Chrome. It won’t work. Rule #2: Firefox good. In fact, probably the best choice. Rule #3: Internet Explorer (IE) is OK, but you must use at least version 6.0 or higher, and if you use version 10 or higher, you need to turn compatibility view on. Here’s the instructions to do that. For those users of the Edge browser in Windows 10, I had one library report some difficulties with it, but after testing here, noticed no problems with Edge. Rule #4: Use Edge at your own risk.
Bibliostat apparently is working on a new interface that will most likely address these browser issues. However, since we are mid-survey cycle, look for this change next year.
Posted in General, Library Management, Technology, Uncategorized
Leave a comment
Friday Reads: The Whites by Richard Price, writing as Harry Brandt
“When I was in prison, I was wrapped up in all those deep books. That Tolstoy crap – people shouldn’t read that stuff.”
–Mike Tyson
The Whites, by Richard Price writing as Harry Brandt (more on that later) tells the familiar story of police detectives chasing criminals. The story mostly follows main character detective Billy Graves (still on the force but relegated to the night shift after some mishaps) and his cop friends (who have all left the force). Each of them has their own “white”, which is a reference to the white whale or Moby Dick. In this case the white is the one person that they believe got away with a brutal crime, but whose guilt cannot concretely be proved. Thus, their white roams free, escaping any societal punishment. Instead of tracking them down, injecting them with M99, encasing them in plastic, giving them their just desserts in a way not suitable for the squeamish (think power tools) and then dumping them into the ocean ala Dexter Morgan, the detectives just remain haunted by the open cases and continue to work the system to try and develop a new lead or evidence to connect the dots. Ho-hum. At least until the whites start turning up dead; certainly not in Dexter Morgan fashion, but dead nonetheless. And Price navigates the moral waters of such a course in a more typical way, at least compared to the morality of Dexter Morgan.
The thing about Price is that there is nothing new in the story or the formula (including a thrilling side story), but where Price excels is in the way he describes the ordinary dialogue and events of these somewhat (at least for cops) ordinary people. It’s what made his previous novels and his writing on The Wire so raw, real, engaging, and so darkly humorous.
Finally, why do we have “Richard Price writing as Harry Brandt”? Here’s Price’s explanation:
“I wrote it under a pseudonym because I intended to write a straight-up urban thriller — which I’ve never done before — and I wanted to have a separate persona for it. However, the book kept expanding and became like any other book I’ve written, so looking back, I wish I hadn’t used a pen name.”
Long story short: Nothing new here, but if you liked his other stuff you’ll like this one. Price also mentioned other writers who adopted pen names and who seemed to morph into those roles with distinction. Although this apparently was his idea from the start (to morph into a literary alter ego), he mentioned that he never really felt that way. Call him what you want (Harry, Richard, Guy, or Fella), but if you go into it knowing that The Whites isn’t any of that “Tolstoy crap” (and not expecting it), you might enjoy it just a little bit.
The Data Dude – Wednesday Watch: Love & Mercy

 Up until now, most (if not all) of the Wednesday Watch topics have been about series works. Today will be the first (if memory serves accurately) feature film. For those of you who might be new, the Wednesday Watch column is the Dude’s alternative or to let’s say compliment to the Friday Reads column. The Dude watches it instead of reads it. At least in most cases. In very limited circumstances, he watches and reads, but always at least watches. But don’t let that stop you from reading, if you like. And if you want to be a guest columnist in this charade, please e-mail your submission. Anyway, today’s contribution is Love & Mercy, the biographical drama about the life of Brian Wilson, co-founder of The Beach Boys. The Dude enjoyed the film overall. There obviously was some editorial license taken, but real life Brian Wilson (who is now 73) called the film “very factual”, so that probably accounts for something. Eight Nebraska libraries have Love & Mercy (DVD) according to WorldCat. It would make a nice addition to your collection if you aren’t one of those eight.
The film goes back and forth between two time periods: The 1960’s (Wilson played by Paul Dano, photo top right courtesy of Lionsgate); and the 1980’s (Wilson played by John Cusack, photo bottom right courtesy of Lionsgate). Apart from the fact that these two cats don’t really look anything alike, the juxtaposition and flashback/flashforward works with the story line. Both of these guys do an excellent job of playing Wilson at very different times in his life. The Dude (being one for nostalgia in this sort of way) especially liked the look of the 1960’s parts – the clothes, the décor, the houses, haircuts, and constitution of the characters (that’s a nice way of saying the women look like real women and the men act like real men, without the “nostalgic” sexism of course). Refreshing looking time period nonetheless, just before the carpet hit the walls on stairways and ceilings. And while the Dude has nothing against carpeted walls and ceilings (and personally digs Graceland’s Jungle Room), the look of the time period represented in the 60’s parts of Love & Mercy is outta sight. For the record, the Dude could find no verification of when exactly the ceilings of the Jungle Room and the hallway leading to it were actually carpeted (the room was created in the mid-60’s); he’s basically judging the time period from the shade of green.
Beach Boys singer (and Brian Wilson’s cousin) Mike Love is portrayed as a rigid clod (which is probably an understatement) who didn’t recognize or appreciate Wilson’s genius, being content with the status quo of manufacturing formulistic California Girls and Surfin’ Safari clones. Whether or not one gets into the business of arguing about a departure from their roots, man (as film version Mike puts it) was a good or bad thing, one can’t help but be moved by Mike’s apparent lack of empathy. Either he had no idea or was, as the film portrays him, an insensitive, self-centered clod.
OK, the film is about Wilson’s mental challenges (he suffers from auditory hallucinations, mostly abusive in nature, subsequent to his taking LSD, and continuing after he stopped taking it), his developing relationship with future wife Melinda Ledbetter, and his overbearing, manipulative, and terrifying psychologist (played brilliantly by high strung Paul Giamatti). The film also works by offering insight into the genius of Wilson’s making of music (e.g. the arranging, writing, and recording). The film aptly offers us a snapshot into Wilson’s head, not only when his creativity shined (and it should be noted still does today) by making music, but when he suffered (not only from lack of treatment for his illness, but worse yet, from exponential mistreatment). All in all, a worthwhile journey to experience by the viewer. So, if you are old enough (the Dude missed it by a few years) you might be inspired to get out your Pet Sounds album (and perhaps shake up an old school cocktail while listening to track #12). If you aren’t (old enough, that is), check out the CD from your local library. You probably won’t be disappointed. And while you’re at it, check out Love & Mercy. You probably won’t be disappointed with that either. Shaka.
Posted in General, Library Management, Uncategorized
Leave a comment
The Data Dude – Public Library Survey Now Available
The annual IMLS Public Library Survey is now available. For those of you who are new directors, it might be helpful to familiarize yourself with the survey and instructions. Take a peek at the Bibliostat Collect portion of the data services section of the NLC website, which has instructions and guides to help you complete the survey, as well as a link to the login screen. Keep in mind that the survey is required for your library to receive state aid if you are accredited. If you aren’t accredited, you still have an incentive to complete the survey ($200), called Dollar$ for Data.
The survey runs until February 19, 2016. Please feel free to contact me if you have any questions throughout the process. You can always start the survey, save your submissions, and then resume at a later date. It doesn’t have to all be done at once. Tip: It’s always a good idea to click on the red “save” button in Bibliostat before clicking “next” to the next screen. Thank you in advance for your participation.
Posted in General, Library Management, Uncategorized
Leave a comment
The Data Dude on Device Ownership
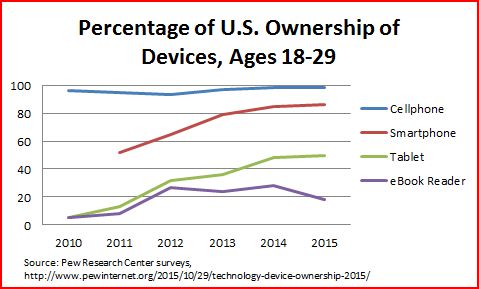 This week, there is yet another Pew Research Center study worthy of regurgitation (the Dude knows this is familiar territory). The report, titled Technology Device Ownership: 2015, details the rise and fall of ownership of devices such as cellphones, smartphones, desktop and laptop computers, tablet computers, game consoles, MP3 players, and eBook readers. While the chart at the right details the specific 18-29 age demographic, those numbers (and trends) mirror the general population (GP). It should come as no surprise that smartphone and tablet computer ownership is on the rise and eReaders, portable gaming devices, and MP3 players are on the decline. It’s fairly easy to understand the reasons for the trend, but in case you might be having trouble the Dude will spell it out for you. The reason is that eReading, game playing, and music listening can just as effectively be done on devices that not only handle those specific functions but do others as well (or multi-taskers, if you will). Example: A smartphone makes phone calls but also can handle your MP3 music files, so if you are out for a stroll and want to listen to some tunes, no need to pack up that MP3 player and AA batteries. Just take the phone. Likewise if you want tunes in your car (and have a more modern car), just plug the phone in. Gone are the days of burning your own CD’s (or cassette tapes); just drag and drop them ol’ MP3’s on your phone and plug it in to the AUX jack on the modern vehicle. If you’ve got a non-modern car, play it old school and turn on the radio.
Now eReading and game playing for most can both be accomplished with a small tablet computer. Forget about separate eReaders and game playing devices; just get one tablet that can handle both of these and many other functions (the price difference isn’t much). For some, games can also be played on the smartphone, depending of course on the game. It’s a bit better experience on the tablet, though, and why not pay a few extra dollars for the color tablet that allows you to download and play games? Because, let’s face it, if you’re like the Dude, you enjoys a bit of Pac Man 256 or Crossy Road now and again. When we think about eReaders, we typically think about basic black and white devices that you can’t do those things on, and you can’t really watch movies or stream video content on those B&W thingy’s. Finally, when looking at these trends ask yourself about your own websites. Are they optimized so that those viewing your site on a tablet or smartphone have a decent experience? Is the site accessible from such devices? It’s been said before and it’ll now be said again. Shaka.
The Data Dude on Project Outcome
 For those of you that are still fizzed from NLA, you might want to check out the Public Library Association’s Project Outcome. Project Outcome began in January, 2015 as a 3 year project with funding from the Gates Foundation. It is a completely free resource. The idea behind Project Outcome is that it provides tools (meaning surveys given to library users that result in some flashy charts and graphs) to measure outcomes. An outcome is defined as: “a specific benefit that results from a library program or service designed to help patrons change their knowledge, skills, attitudes, behavior, or condition.” Now there are a lot of buzz words surrounding things like Project Outcome, so the Dude will summarize things by saying that Project Outcome is designed to be a simple tool to provide you with a snapshot of how your library is doing (and what you might need to improve on). The Project Outcome people say that the goal is to address the “need for better data to demonstrate the value of your public library programs and services.” The surveys are short (6 questions in length), and cover 7 different areas: civic/community engagement, digital inclusion, early childhood literacy, economic development, education and lifelong learning, job skills, and summer reading. You don’t have to do surveys for all of the areas; rather, you can pick and choose the ones you want.
For more information about the Project, here is the latest webinar, or this video contains an overview of the initiative. Shaka.
The Data Dude on the 2014 Digital Inclusion Survey Results
Shaka. The results from the 2014 Digital Inclusion Survey are now available. Here is a link to the press release and a number of the reports. The Nebraska page can be found here. You can view the specific data and profile for your library by typing your library name in the search box (just make sure your browser is up to date if you have problems). Digital inclusion addresses both the digital divide and digital literacy. Thank you for your participation in last year’s survey (our response rate was much higher than the previous year). Here is a brief summary of how Nebraska compares to the national average on some of the digital inclusion areas (for a complete list, go to the link on the Nebraska page and scroll down):
2014 Digital Inclusion Survey Results
| Nebraska | National Avg. | |
| Avg. Download Speed | 10 Mbps | 16 Mbps |
| Avg. Number of Public Access Computers/laptops | 13.3 | 18.8 |
| eBooks | 79.1% | 90.3% |
| Online Health Resources | 38.8% | 76.8% |
| Mobile Apps to Access Library Services | 25.9% | 42.7% |
| General Computer Skills Training | 81.9% | 86.9% |
| General Familiarity with New Technologies (e.g. using eReaders, tablets) | 59.0% | 61.8% |
| Social Media (e.g. blogs, Twitter, FaceBook, YouTube) | 62.3% | 57.2% |
| Summer Reading for Children | 90.5% | 95.4% |
| GED or Equivalent Education | 20.9% | 34.9% |
| STEAM (Science, Technology, Engineering, Arts, and Math) Events | 20.4% | 34.2% |
| Applying for Jobs | 66.2% | 73.1% |
| Accessing and Using Online Business Information Resources | 26.4% | 47.9% |
| Providing Work Space(s) for Mobile Workers | 39.3% | 36.1% |
| Hosting Community Engagement Events (e.g., Candidate Forums, Community Conversations): | 32.8% | 40.2% |
| Hosting Social Connection Events for Young Adults (e.g., manga/anime, gaming, book groups): | 43.3% | 59.8% |
| Identifying Health Insurance Resources | 48.3% | 59.4% |
| Locating and Evaluating Free Health Information Online | 57.2% | 57.7% |
The Data Dude on chirs
“Vulnerability is the birthplace of connection and the path to the feeling of worthiness. If it doesn’t feel vulnerable, the sharing is probably not constructive.”
–Brene Brown
Recently, the Dude attended the Kaneko Information Exchange conference at Kaneko-UNO Library. It’s hard to describe the space there; it might be apt to say it’s a cross between a modern, technology infused library and a hip art gallery. At any rate, a lot of fresh ideas were exchanged at the conference, and the subject of today’s post is about the consumer health information resource service (chirs) offered by the University of Nebraska Medical Center’s McGoogan Library of Medicine. One of the panelists at the Information Exchange (Teri Hartman) was from McGoogan and talked about chirs.
But before we get to that specific part (and if you only care about the chirs service, skip to the last paragraph), here is a little filler material of the sort that Brene mentions in the quote above. A couple of years ago, the Dude found himself with a health issue that required attention. Middle age, evidenced not only by these sorts of health circumstances (it was a hernia) is now a reality but not necessarily a catalyst for an abnormally depressive state. The Dude has no intention of buying a sports car, bar hopping with women that are half his age, completing extreme sporting events (which may mean different things to different people), dyeing his hair, or trotting off to Burning Man. Middle age for the Dude means the replacement of long runs and bike rides with long walks and tai chi chuan sessions; early morning workouts replaced with early morning sleep and late night insomnia; and other assorted fortuitous activities such as growing tropical plants and fixing things. It also means other adjustments, such as the simple acknowledgement of how life experiences are now just a bit different, and that’s OK.
Now as far as health information goes, the Dude believes in the importance of a well-informed patient. Navigating these waters is often difficult; when the hernia diagnosis hit there was a lot of research and weeding through questionable sources of information online. You see, some camps surrounding the Dude were quite adamant about not having a surgical repair at all; others wanted the Dude to drive to a knife jockey at the earliest possibility. What the Dude really wanted (and didn’t get much of) was someone who would acknowledge and support his process of becoming (perhaps in a Kierkegaardian sense) health literate, and a medical professional that didn’t find a well informed patient threatening. In the end, the Dude was fortunate enough to have an overall positive experience, and credits this to taking the time to become health literate and in finding such a patient and knowledgeable surgeon. For the record, if you want to know about things like Desarda or Bassini techniques, differences in brands and types of mesh typically used for repairs, and the journey to ultimately finding someone to fix the problem (the Dude had a good experience at Creighton Med. Center), let the Dude know. In the Dude’s case, being literate in the area of concern (that’s a runaround way of saying he wanted as much preferably unbiased information as possible about hernias) meant not only determining a course of treatment but also selecting a health care professional.
The point here is that two years ago, the chirs service was not on the radar and therefore it wasn’t utilized. In retrospect, the service could have been extremely helpful. At the Kaneko Information Exchange, Teri Hartman (Education and Research Services Librarian at UNMC’s McGoogan Library of Medicine) talked at length about the free service. And you should at least be aware of it, if not actively promoting it in your library. The chirs web page contains a summary of the service, links to sites containing health information, contact information, and the chirs online request form. You should also keep NebraskAccess in mind as a potential source of information. Finally, thanks to Teri Hartman and her contributions to the Kaneko Information Exchange. In case you didn’t catch it yet, the chirs service is free. Shaka, Teri.
Posted in General, Library Management, Technology, Uncategorized
Leave a comment
The Data Dude – OverDrive Data Prefilled on Survey
Just as the Dude was ready to start on a couple of rather extensive posts in response to some abstract concepts, he received a call from some overachievers who were compiling their OverDrive circulation data since their fiscal year has now ended. Actually, this was a good thing, because it led the Dude to revise the Bibliostat page of the NLC website and brought his attention to some material there that was just a tad outdated. The pages should now be up to date, but if you notice any errors, please let me know.
This reporting on the survey is always confusing. For one, the survey asks for “Children’s” circulation, but OverDrive doesn’t use that same terminology. It uses Juvenile and Young Adult. Some might disagree, but the survey instructions indicate that you include young adult titles with children’s, so that is where they are counted.
Here’s the good news: You don’t even have to open that guide if you don’t want to. For OverDrive, all these numbers, for both consortium holdings and OverDrive circulations (both adult and children’s) should be prefilled on your survey. In past years, this was the source of a lot of undue stress and confusion about how to get these figures and how to do the necessary math to fit them into both adult and children’s categories. Well, math no more; prefill is our friend. It should be noted that if you have another service other than OverDrive, get out your calculators because you will need to add those numbers to the prefilled amounts. And for those of you who have a subscription to eBooks or Audiobooks with a patron-driven acquisition model (that’s a fancy way of saying that your library has access to a massive collection of eBooks or Audiobooks and you only pay for what your patrons want to read/listen to), then you need to get a bit creative.
For these types of things (we’re talking eBooks, Audiobooks, or videos here) the key is whether or not they are “returned” or permanently retained. Keep in mind that downloading something to a device only to have it disappear after a set period of time is the same thing as returned. For these things, you count the number of items circulated both as holdings and circulations. In other words, if you have access to a service that has a catalog of 1,000,000 eBooks and during the course of your fiscal year there are 10,000 eBooks that are downloaded, then you count 10,000 for your eBook holdings and 10,000 added to your electronic materials circulation. If the items are retained and not returned, then you count those under electronic collections (in the technology part of the survey). There is a guide on the website that was originally created by the state data coordinator from Arizona, and tweaked for use in Nebraska. Shaka.

