Search the Blog
Categories
- Books & Reading
- Broadband Buzz
- Census
- Education & Training
- General
- Grants
- Information Resources
- Library Management
- Nebraska Center for the Book
- Nebraska Memories
- Now hiring @ your library
- Preservation
- Pretty Sweet Tech
- Programming
- Public Library Boards of Trustees
- Public Relations
- Talking Book & Braille Service (TBBS)
- Technology
- Uncategorized
- What's Up Doc / Govdocs
- Youth Services
Archives
Subscribe
Category Archives: Information Resources
The Data Dude on Social Media – Pt. 2
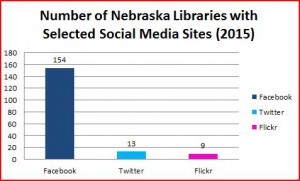 After last week’s post, which admittedly was thrown together at the last minute in order to meet the one post a week deadline (yes, I’m playing a self-inflicted weekly match-it game with Lori Sailors), the Dude got to thinking more about libraries and social media. If you look at the library markers on the public library maps from the NLC website, there are links to selected social media sites for each library (e.g. Facebook, Twitter, and Flickr). The bar chart to the right uses the data from the map, showing the distribution of social media sites used by Nebraska libraries. The data comes from the NLC supplemental survey, and after looking at the supplemental survey, some revision might be in order. How many of you have active Delicious accounts? LibraryThing? These are both options on the supplemental survey but not Pinterest or Instagram. Well, perhaps we will work to revise the supplemental survey so that these might be options. Are there others? If so, let me know.
Now, as the chart illustrates, Facebook (or is it facebook?) is the dominant force here (if you don’t understand why, check out last week’s post (or just look at the bar chart) for a better understanding of the dominance of facebook. Perhaps you could also double check your marker on the aforementioned maps to make sure that they provide the correct link to your library’s social media pages. If they don’t, you can update that information via the supplemental survey. This can be done at any time, although reminders are sent around the time of the public library survey.
Arguably, what’s more important is keeping your social media sites updated. Having a twitter account and only tweeting once a year is neither worthwhile nor effective at getting your message out there. Which brings the Dude to the next point and that is what icon to use for these various sites. Facebook isn’t too difficult, anything with the lower case f on a blue background. Twitter, however is a bit trickier. Do you use the lower case t or one of the variations of the little birdy? Do we assume that everyone knows that the birdy represents twitter? For Pinterest, the cursive p will do, but should you choose the circle or square background? Flickr’s are a bit more complicated, with numerous blue and pink dots and various renderings of lower case fr’s. The Dude imagines that someday we will have throwback icons similar to that of baseball uniforms and soda packaging (if we don’t already). Shaka.
The Data Dude on Social Media Use
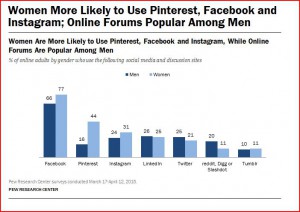 Today’s post will be a little blip about social media use. A recent Pew Research Center study took a look at gender and social media use and compared it to findings from previous years. While there once was a noticeable gender gap between men and women (with women being more likely than men to use social media), there is no longer such a noticeable difference. Does your library use social media? If so, what do you use and for what purpose? If you are interested in setting up social media sites or pages are you aware that there is help from the Nebraska Library Commission? If you’ve been meaning to do this but need some assistance, contact the NLC Technology and Innovation Librarian, Craig Lefteroff.
According to the Pew survey, there are some differences in the type of social media used by gender. As the chart indicates, Facebook, while still used more by women than men, remains the most frequently used site overall. Pinterest is dominated by women, and men are more likely to use discussion forums and slightly more likely to use Twitter. The point to this is to have a better understanding of the various social media options for your library, and to understand the benefits of using social media to reach your community. Of course, this is only the starting point in gathering data on the demographics of your local community. Another great source for information to help with setting up and maintaining a social media site is the Nebraska Libraries on the Web site and blog. Check it out and you might come away with a fresh new idea or two. Shaka.
New State Agency Publications Received at the Library Commission
New state agency publications have been received at the Nebraska Library Commission for July and August 2015. Included are titles from Colleges and Universities, Emergency Management, Highways and Roads, and the Department of Insurance, to name a few.
Free Business Program: Recordkeeping Basics and Benefits
 Do you have a telephone line in your meeting room? A speaker phone? If yes, you can have a terrific “Lunch ‘n Learn” program for your community’s business people.
Each month GROW Nebraska features a different presenter and topic related to marketing or small business. September’s presentation is on September 17 from Noon to 1:00 p.m. The trainings are FREE and open to the public.
Recordkeeping Basics and Benefits
What are the benefits of keeping good records for your business? Which expenses are deductible on your tax return? What are the IRS substantiation requirements? Join J’Nan Ensz, CPA and Managing Member, Accounting and Business Consulting Group, LLC as she answers these and other questions about good record keeping. In addition to staying in compliance, good record keeping will help you determine the profitability of your business.
Registration is required at www.grownebraska.org to receive connection information.
The Data Dude on Census Narrative Profiles
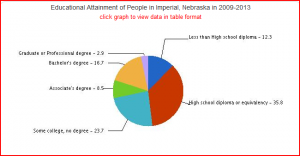 As a number of you work through your accreditation applications, you might also be reviewing your strategic planning documents. Today’s post is about the Narrative Profile from the Census Bureau’s American Community Survey. As you gather information about your community, this simple yet powerful tool might help you with your planning. The Narrative Profile covers 15 different topic areas; users can start their search by zooming in on a map or by using dropdown menus (Step 1). For today’s illustration, a library community was chosen at random, the Lied Imperial Public Library, or the Imperial, Nebraska community.
Here is how you get your Narrative Profile: After choosing “Dropdown Menus” from Step 1, you then select a geography level from step 2. In this case, Imperial is a “Place”, so we select Place and then Nebraska > Imperial city, Nebraska from Step 3. There are other options besides place, including geography levels such as county, Census Tract, Zip Code, or Metropolitan/Micropolitan Statistical Area (Metropolitan=core urban area of 50,000 or more population; Micrpolitan=core urban area of 10,000 or more population, but less than 50,000). After the place of Imperial is selected, there is a link at the bottom that says “Get Profile”. Clicking on this spits out a report that you could either print, save, or copy and paste parts of it, including the many charts and graphs that it contains. The data covers 2009-2013.
The report contains data from various topical areas. For starters, if we look at household data there are 900 households in Imperial, of which 52% are married couple families. There are 30.8% persons that live alone and 17.2% are other families or nonfamily households. 14% of the population in Imperial spoke a language different than English at home, and 94.2% of that 14% spoke Spanish. The education data is expressed in a pie chart that was generated in the Narrative Profile, located at the top of this post (click on the chart to expand and actuall read it).
There are many additional categories, including data tables and illustrations such as the one above. Some of these are employment status and type of employer, industries (retail trade is the highest at 26.7%), occupations, commuting to work (81.1% drive alone and 9.8% walked), income (women, unfortunately make about $14,000 less than men in Imperial), poverty rate (12% overall), health insurance (16% do not have insurance), population age distribution, and housing characteristics.
While the Narrative Profile certainly isn’t as comprehensive as the reports you can build from the Advanced Search section on American FactFinder, for a quick snapshot of your community it’s a good starting point. And it has the extra benefit of producing some nice basic charts and graphs that you are free to copy and paste. The Dude likes not only reliability, but simplicity. Shaka.
Posted in Census, General, Information Resources, Library Management, Uncategorized
Tagged census
Leave a comment
The Data Dude – Basic Public Library Survey Guide
 Shaka. The purpose of today’s post is to let you know about a new basic public library survey and Bibliostat™ guide that has been posted on the NLC website. If you are new to the IMLS public library survey or are looking for a brief refresher, this is a good place to start. Bibliostat™ is the data collection tool that Nebraska currently uses to collect data for the public library survey. States are free to use whatever method they choose; in Nebraska it is Bibliostat™. The aforementioned guide also has a bit of background about the public library survey, as well as the basic Bibliostat™ navigation. You can also print a copy of the survey and instructions from the data services section of the NLC website. This may help you to compile some of the data ahead of time, instead of scrambling around at the last minute. As always, if you have questions, don’t hesitate to ask.
The Data Dude – Virtual Visits (Revised)
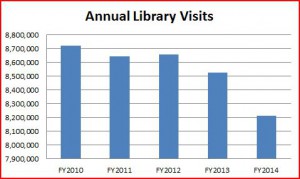 Shaka. Last week, I blogged about a new element on the public library survey asking you to report virtual library visits, and the definition I posted has been revised (and hopefully will provide some clarity). I’ve worked it over, and the revised language is below. For those of you that provided feedback, thank you! I hope to clear up the confusion in this post today, and will revise the earlier post to reflect the change in the question definition. I apologize for the confusion. Keep in mind that this is not a federally required question. If it is difficult or impossible for you to collect this data, you are free to enter a 0. However, my earlier blog post provided the background on why state data coordinators (SDC’s) believe collecting this data is important.
What we are trying to do is to capture the number of unique visitors to your website for a sample time period (each day), and then obtain an annual figure based on that sample. Now, what is a unique visitor? In short, if you have one person (as determined by their IP address) who accesses your website numerous times in one day, say 10 times, you count them once (even though they had 10 “user sessions”). If they come back tomorrow and do the same thing, count them again for that day. So every day, you start over with a new count of unique visitors to your site during the sample time period. You collect the number of unique visitors for a time period, for example, a month or “typical week”. If you’ve collected the data for a week, multiply by 52 for an annual figure, or if you’ve collected it for a month, multiply by 12. The goal here is to provide a decent balance and provide counts that are comparable to how you capture physical visits (or gate counts).
Here is the revised definition:
6.18. Total Annual Number of Virtual Library Visits to Library Website: Unique visitors is the number of inferred individual people as determined by IP address (filtered for spiders and robots), within a designated reporting timeframe (each day), with activity consisting of one or more visits to a site. Each individual is counted only once in the unique visitor measure for the reporting period, in this case, each day. The number of annual virtual visits can be calculated by summing the number of unique visitors each day for a one month time period. You may also report an annual figure based on a “typical week” (see definition below). Multiply by 52 weeks for an estimated annual total. A “typical week” is a week that is neither unusually busy nor unusually slow. Avoid holiday times, vacation periods for key staff, or days when unusual events are taking place in the community or the library. Choose a week in which the library is open its regular hours. Include seven consecutive calendar days, from Sunday through Saturday (or whenever the library is usually open).
The Scout Report Reviews Public Libraries Online
 The Scout Report, that weekly compendium of reviews of quality interesting and useful Web sites, offers a look at Public Libraries Online, the companion to the Public Library Association’s print journal, Public Libraries. I almost always find something interesting in the Scout Report, which I get via email. I really appreciate their help in keeping up, and Public Libraries Online is going on my regular reading list.
Symposium on Education in Nebraska: July 23, 2015
 Along with Rod Wagner, Sherry Crow and Sally Snyder, I’m attending the Symposium on Education in Nebraska–and the focus is Opportunity and Access. There is a great deal of interest in how digital resources expand opportunities, and access is at the heart of this. And since libraries are all about access, we can be at the center of this movement.
Dr. Gary Lopez, presented the keynote address on the NROC project to develop and distribute digital resources for education—lessons, courses, curricula. He stressed that the project has an open access philosophy, developing digital resources for millions of students from middle school to college.
NROC http://www.thenrocproject.org ) developed specific digital resources & curriculum…Math and English for starters…to address the achievement gap in education. Addressing achievement gap by transitioning the one-size-fits-all system of education to an adaptable system…from analog to digital should mean that learning can be personalized to individuals—assuring that student feedback drives repetition to address specific gaps. Personalized learning is adjusting the pace (individualization), approach (differentiation) and connection to the student’s learning interest and experiences. Resources are available through hippocampus.org and edready.org. Comment below about your reaction to the library role in this evolving change in education and learning.
About NROC
“NROC” started as the National Repository of Online Courses. Now we are much more. The NROC Project is a national, non-profit movement impacting college & career readiness. Our project is funded by the Bill & Melinda Gates Foundation, The William and Hewlett Foundation, and most importantly by NROC members across the country. Our member institutions represent more than 6 million students from middle school to college across the U.S. We are leaders who believe in open and equal access to education and the power of new media to personalize learning. Together, we’re building content and applications to impact student success and delivering them publicly at websites like HippoCampus and EdReady.
The Data Dude – Reporting Electronic Stuff Pt. 2
 Last week we looked at reporting electronic stuff (mostly eBooks and Audiobooks) on the annual public library survey. This week will focus on one particular aspect of that, called electronic collections. Now historically the public library survey has had questions about databases. These include the databases provided by the Library Commission (NebraskAccess) and any databases offered locally by the library. So first off, what is a database? Well, a database is generally an electronic (online these days) catalog or index that contains information about published items, and in most (but not all) cases, the items themselves. This might include journal articles, magazines, newspapers, reference information (including images and video), books, or other documents (e.g. the historical Census records from the My Heritage database on NebraskAccess would be an example).
Now, the intent of some state data coordinators (SDC’s) was to broaden this definition a bit to include things that might not technically fit into the historical database mold, but don’t necessarily fit anywhere else either. These include things like Freegal, Zinio, Mango Languages, TumbleBooks, Tutor.com, and many many others. So someone proposed changing the definition from “database” to the broader “electronic collection” (although arguably these could all fall under the database umbrella, and many SDC’s make the argument both ways), and then capturing the number of times the electronic collection is used. Oddly, the SDC’s voted to change the definition of a database to the broader electronic collection, but not to capture or report the number of uses. To the Dude, it doesn’t matter much if you call it a database, electronic collection, or a duck, the real question is what is it and whether or not it is valuable. It also might be useful to know what kind of duck or ducks they have next door, in case you want to avoid duplicating the Joneses, or just want to keep up with them.
To the Dude (and on the state level), it seems important to know what databases…ahem, electronic collections, that libraries subscribe to, and to know how many times they might be used. When looking at something like Freegal or Zinio, the number of uses seems simple – each downloaded item counts as a single use. It gets much more complicated when discussing other electronic collections such as Ebsco or Mango Languages, because you don’t want to count each search as a use. It seems more relevant to count each log-in as a session. Someone logs in for a half-hour to work on Mango Languages? Count it as one use. Someone spends an hour on Ebsco, count it as a use. Well, technically and if possible from the reporting scheme, you could count each article downloaded as a use. 1 download = 1 use. If you count the download as a use, don’t double count the session as a use.
So this year, while you will report the number of local electronic collections (and we will prefill the number available via NebraskAccess) there will be a question that asks to list the names of the electronic collections you subscribe to. Note that you don’t include collections that are freely available on the web. There will be an optional question that will allow you to report the number of uses. This will be set up as a “repeating group”. In other words, you can enter “Zinio” for the electronic collection and then enter the number of times it was used. Next, you can add another electronic collection (group) and the number of uses. If you don’t have the data for the number of uses, you can just list the database titles (e.g. Zinio, Mango Langauges, Tutor.com, etc.). You could also enter the number of uses for one but not another (e.g. Freegal may be easier to report useage than Ebsco). Now, don’t get bent out of shape, the number of uses is optional. If you don’t know or you didn’t collect the data, enter N/A and a note in the note field that says “not collected” or “data not available”.
You should note that this applies to things that are kept by the library patron. Things that are returned (e.g. eBooks that are “returned”) are reported in a different area, covered in last week’s blog post, Reporting Electronic Stuff Pt. 1. Shaka.
National my Social Security Week, July 19-25
 Social Security is excited to announce that July 19-25, 2015 will mark the second National my Social Security Week. During this week, Social Security will host numerous events and activities across the country to raise awareness about the benefits of having a my Social Security account and to encourage the public to sign up for their account at mySocialSecurity.
Libraries can partner with Social Security by helping to promote and ensure that Americans sign-up for their own mySocialSecurity account. Here are the resources to help you help the people you support. We encourage you to use the information and resources found at my Social Security Information for Groups and Organizations: Learn more about Social Security, Banners and Web Graphics, Newsletter Articles & Blog Posts, Social Media, Fact Sheets and Publications, Posters, Public Service Announcements for Radio, Videos, and a Toolkit.
TechBoomers Offers Online Technology Education for Library Customers
 What is Techboomers.com? Techboomers.com is a free educational website that teaches older adults and other inexperienced Internet users with basic computer skills about websites that can help improve their quality of life. The courses are free and many libraries and other technology education organizations are using them to teach their students.
These are the top 10 most popular courses:
1) Facebook: http://www.techboomers.com/p/facebook [1]
2) Netflix: http://www.techboomers.com/p/netflix
3) Skype: http://www.techboomers.com/p/Skype
4) Twitter: http://www.techboomers.com/p/twitter
5) Google Search: http://www.techboomers.com/p/Google-search
6) WedMD: http://www.techboomers.com/p/webmd
7) Ancestry: http://www.techboomers.com/p/ancestry
8) Google Maps (including Google Earth): http://www.techboomers.com/p/google-maps
9) Amazon: http://www.techboomers.com/p/Amazon
10) Etsy: http://www.techboomers.com/p/etsy
Check them out and comment below RE: whether you think your library customers would find these useful.
The Data Dude – Reporting Electronic Stuff Pt. 1
 One of the difficult parts of the annual public library survey has not just been what to count, but where to report what is counted. This is true for reporting revenue, expenditures, staffing, and other things, but the focus here today is where to count electronic stuff. While it is relatively easy to count print materials (books and serials), audio physical materials (CD’s and playaways), and video physical materials (DVD’s or VHS for the old skoolers), counting the downloadable versions of those items and other electronic things becomes a bit trickier.
More and more often libraries are offering online access to things, including language and other educational courses, music and video downloads, downloadable magazines, and others. Now, when considering reporting these types of things, the key element here is to first ask this question: Is the electronic stuff checked out and returned (even if the return is that it magically disappears from your device after a set checkout period)? If so, then most of the time these are reported under one of three holdings categories on the survey: (1) eBooks; (2) Audio Downloadable Units; or (3) Video Downloadable Units. These are all reported on your survey in section 4, Library Services. The kicker here is that if you report these electronic items in the holdings part of the survey (section 4), you also need to report the number of times they are used (circulation), in section 5, Library Services, and vice versa. This represents a slight change in the data element definition in previous years, due to a vote by state data coordinators. Example: You report x number of OverDrive holdings, and x number of circulations. It gets tricky when we consider content that has a set circulation period but the library doesn’t select the items available to the user. Hoopla would be a good example of this, where the library pays for access to the vast quantity of items in the Hoopla collection, and then pays per item downloaded by the patron. The patron selects the item they want to read, watch, or listen to. This is well known as “patron driven acquisition”, and makes sense in that the library isn’t purchasing things that might sit on the shelf collecting dust or just infrequently used. Now for these things, reporting holdings is a bit tricky because even though the user may have access to millions of items, the library only pays for items that are downloaded or used. In this case, the holdings information can be reported in a reverse-engineered fashion based on the number of uses. You have 10,000 eBooks downloaded in the FY (out of 1.2 million available)? You report 10,000 eBooks held, and 10,000 uses. The Dude doesn’t know any other way to report this. Keep in mind that the important number here is the uses, so don’t get too caught up on the holdings reporting. And this only applies to things that circulate all the way around (e.g. are “returned”)
This post is part 1 of reporting electronic stuff. Part 2 will explain the data element changes for databases, which have been re-named “electronic collections”. Shaka.
New State Agency Publications Received at the Library Commission
 New state agency publications have been received at the Nebraska Library Commission for June 2015. Included are titles from Nebraska Department of Agriculture, Nebraska Department of Health and Human Services, Public Power, and University of Nebraska Press, to name a few.
The Data Dude – Early Literacy
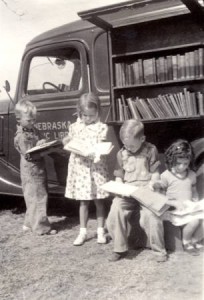 Believe it or not, the Dude is working on next year’s public library survey, scheduled to launch around mid-November, 2015. And to those of you who I promised no major changes, I apologize. There will be changes and some will be major. Some will be minor. Before you get bent out of shape, let me explain that some of the major changes will be for the better; clarifying some things that were difficult to understand in the past, pre-filling more data to help you with the survey, and hopefully make your life a bit easier during survey time. For today’s post, the focus is something the Dude read on early literacy; specifically the well known library program called 1,000 Books Before Kindergarten. Many Nebraska libraries offer this program. It’s generally thought to be a passive library program, but nonetheless, you can count it as a children’s program on your survey. If you are looking for more information about the program, read this article about three-year olds Gidget and Jaycee Crocker, from McCook, Nebraska. Most would agree that these are good programs, helping to promote early literacy and familial connections. However, we have no data on these types of early literacy programs. On the next survey, you will be asked how many children’s programs are specifically focused on early learning and literacy (pre-K)? And remember, while we would like you to collect and report the data, if you simply don’t have it this year because you have not yet implemented a mechanism for counting, you can look to the minus 1 (-1), which is entered when the data is not available or not collected. Now, as the Dude pointed out before, the minus 1 isn’t always the desired answer, but sometimes it is the best one. Shaka.
Posted in General, Information Resources, Library Management, Uncategorized
1 Comment
Free Immigration Webinar
 On July 2, 2015, the Institute of Museum and Library Services (IMLS) and U.S. Citizenship and Immigration Services (USCIS) will host a free webinar for public librarians on the topic of immigration and U.S. citizenship. Join in to learn more about what resources are available to assist libraries in providing immigrant and adult education services. The webinar, Overview of myE-Verify, will explore a new online service for the general public. Representatives will be on hand to discuss how the service can be used to:
- Confirm their work eligibility with Self Check
- Create a myE-Verify account
- Protect their Social Security number in E-Verify with Self Lock
- Access myResources, a multimedia resource center to learn about their rights and their employer’s responsibilities.
Webinar Details:
Date: July 2, 2015
Time: 2:00 – 3:00 p.m. EDT
Click here to register
This series was developed as part of a partnership between IMLS and USCIS to ensure that librarians have the necessary tools and knowledge to refer their patrons to accurate and reliable sources of information on immigration-related topics. To find out more about the partnership and the webinar series, visit the Serving New Americans page of the IMLS website or on the USCIS website.
The Data Dude – IMLS Compare Tool
 IMLS has recently updated the Compare Public Libraries and Search for Public Libraries tools with FY 2013 data. If you are looking for Nebraska library data, the best place is on the NLC website, in the data services section. Those statistical reports are available back to 1999. However, you might think that the Compare tool is a bit less relevant because it has FY 2013 data instead of the FY2014 Nebraska data. Keep in mind that IMLS has different groups of states that have different public library survey submission dates (so that all 50 states – plus U.S. territories) aren’t being submitted at the same time. The Compare tool is a great tool. It is easy to learn how to use and navigate just by operating it. One thing of importance is that this tool is valuable to identify your national peers. The Compare tool allows you to generate a report based on the factors reported in the survey, but one important one is the legal service population (LSA) of your library. To do this, first begin your search by finding your library. Next, click on “Choose Similar Libraries (Comparison Group) by Variable”. You can select any variable, but if you want LSA, click on the + sign next to Organizational Characteristics, then Population of Legal Service Area. I like Method 1, which defaults to 20%, but depending on your library a more realistic percentage is 5% or 3%. The Compare tool will then tell you how many libraries are in your comparison group. You can either add another variable, or if you just want the data for those libraries, click on Continue. On the next screen, expand each category you want data for (or you can select all of them). You can then look at the data from the libraries in your comparison group, or export it to an excel file from the link at the top. Shaka.
Focus on Nebraska authors: Jonis Agee
Omaha native Jonis Agee grew up in Nebraska and Missouri so they are often the settings for her novels. The New York Times Book Review called her “a gifted poet of that dark lushness in the heart of the American landscape.” She is a Professor of English at the University of Nebraska-Lincoln and teaches creative writing and twentieth-century fiction. She earned her BA at the University of Iowa and her MA and PhD from the State University of New York at Binghamton.
Jonis has been awarded two Nebraska Book Awards for The Weight of Dreams and Acts of Love on Indigo Road and three of her books — Strange Angels, Bend This Heart, and Sweet Eyes — were named Notable Books of the Year by The New York Times. She is the co-writer, with her husband Brent Spencer, of the screenplays Full Throttle, Baghdad Rules and Everlasting. Together they live on a small acreage north of Omaha in Ponca Hills. Of her five novels four are included in our book club collection: The River Wife, Strange Angels, Sweet Eyes, and Weight of Dreams. In each she creates a strong sense of Midwestern place alongside compelling family dramas laced with grit. Please consider selecting one of Agee’s titles for your next book club selection.
Posted in Books & Reading, General, Information Resources
Leave a comment
GROW Nebraska Workshop July 2
 Omaha’s SCORE chapter will host GROW Nebraska for an informative small business workshop Thursday, July 2, from 9:30 a.m. to 11:30 a.m. at the SBA Nebraska District Office, 10675 Bedford Avenue, Suite 100, Omaha. Janell Ehrke, CEO of GROW Nebraska, will explain how the non-profit organization connects entrepreneurs to the world marketplace.
GROW Nebraska provides entrepreneurial coaching and market access opportunities to its members, creating sustainable economic development for more than 350 small business members through promotions, market access and education. They offer more than 20 services, including initial consultations, counseling, product evaluation, and are on the cutting edge of social media marketing training.
GROW Nebraska also allows members to choose to participate in everything the organization offers, or just pay only for low-cost services that best suit them. Instead of forcing one-size-fits-all approaches on each small business client, GROW encourages its members to develop a plan that benefits their business the most.
There is no charge for the workshop, but please register by calling Marilyn Riley at the SCORE office at 402-221-3606 or email score@scoreomaha.org, as space is limited.
The Data Dude – Robots in the Library Makerspace
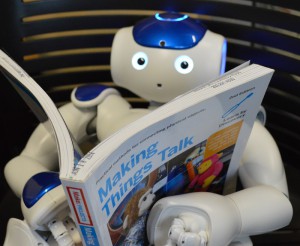 The Dude has been on vacation (and after travelling with two kids ages 4 and 8, discovered that there are some pretty decent shows on Cartoon Network—favorites include Uncle Grandpa, the Regular Show, Steven Universe, and Teen Titans Go!), but wanted to share an article about the Westport Public Library in Westport, Connecticut. Two things caught the Dude’s attention: (1) The robust makerspace at this library – specifically, the acquisition and availability of robots; and (2) the possibilities for programming these robots, as evidenced by their Tai Chi demonstration. For the record, the Dude is a student of Chen style Tai Chi; it looks like the robots are programmed to do some type of Yang style. It’s not that one is necessarily better than the other, but there are differences. Nonetheless, it interestingly illustrates what can be done in this library’s makerspace. The draw to the robots is similar to the idea of libraries offering the CoderDojo, except in this instance you are programming the robot and not websites, games, and apps. These robots can speak 19 different languages. If you are considering expanding your makerspace offerings, check out the makerspace section of Westport’s website, complete with videos and a blog. Shaka.
Photo courtesy of Westport Public Library, Westport, CT.


