For today, we are looking at some data as it relates to libraries offering alternative services during the COVID-19 crisis. Specifically, we are looking at a potential shift to electronic resources, in this case, OverDrive. But first, I want to provide a link to the fantastic data that is being put out by the Nebraska Department of Labor. From the DOL main page, I was looking mostly under their resources, then INFOLink pages, for raw data about unemployment statistics and claims. Next, I found their visualizations, which are excellent, and detail unemployment claims by county with maps, and some very illustrative charts. If you have a chance, visit their visualizations HERE.
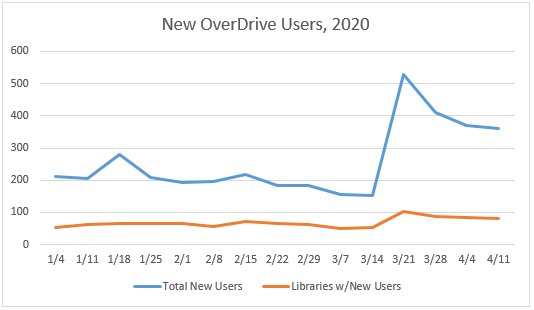
Now, to OverDrive. From my colleague here at NLC, I got some data about new OverDrive users, and OverDrive circulations. I was curious to see if there was a correlation between new users and circulations as many libraries shut down operations or offered modified services, such as curbside pickups. The first graphic illustrates libraries with new OverDrive users, and the total number of new users, for the weeks beginning in January, 2020:

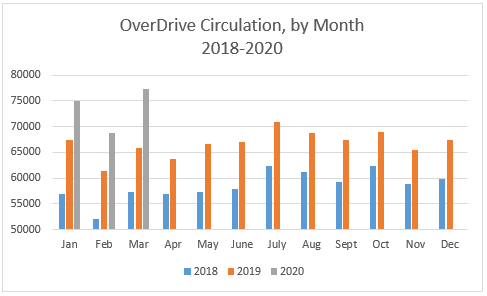
As the chart illustrates, there was a spike during the week of March 14 – 21, then a leveling off. Next, I looked at OverDrive circulations, and you guessed it, they increased:

But wait. There’s more to this chart. For this one, I visualized the data from the previous 2 years, 2018 and 2019. If we look at March, we see the large spike in OverDrive circulations from 2019 to 2020, but it helps to put this in perspective. Between March, 2018 and March, 2019, circulations increased at a rate of 15.07%. From March, 2019 to March, 2020, circulations increased at a rate of 17.33%. So a slightly higher percentage of circulation growth compared to the prior year. For February, the 18-19 increase (17.98%) was higher than the 19-20 increase (12.15%). April data might be the telling point to look at, and I intend to post about that when it becomes available.

