Ho-hum. For those of you that are interested in all the mumbo-jumbo of why this survey is important, skip to the next paragraph. If you are busy and have a short attention span like the Dude, read just this first paragraph and spend the time you would have spent reading the rest of this blog post to
actually complete the survey. If you are
really busy, go to the
survey right now. The survey collects data about library roles in
digital inclusion (getting haves for the have nots when it comes to technology). The Dude promises it won’t take long for you to do the survey and the Dude would really like it if you did it. The state and National Budget Dudes use this information to (hopefully) make things better for the have nots. The survey also hooks you up to a groovy
interactive map, where you can look at demographic, economic, education, and health information for your service area. You can also compare your library’s stats with those in surrounding communities (1, 3, 5, and 10 mile radiuses). Your
login code (same as your Bibliostat™ Collect login) is listed on
this page (so you don’t even have to track it down), just find it on the page and enter it in the box at the top to begin the survey. Individual branches should also complete the survey. Shaka.
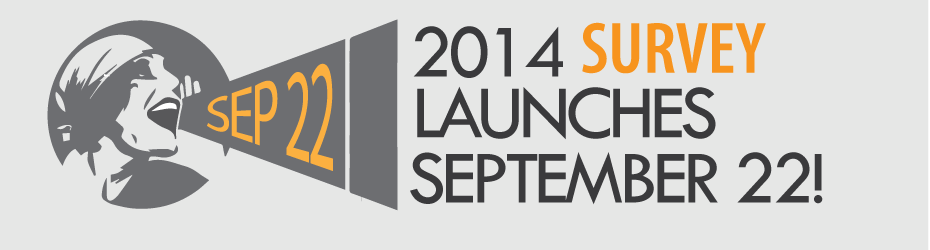
The 2014 Digital Inclusion Survey (second annual) is now available. The survey will explore the digital inclusion roles of public libraries. Digital inclusion addresses the digital divide and digital literacy in a synthetic way. It includes three basic aspects:
- ACCESS: Availability and affordability, including equipment and tools necessary for all persons to obtain access.
- ADOPTION: Technological and digital literacy skill sets that allow the user to utilize the equipment confidently.
- APPLICATION: Use of the access by digital literate individuals in practical applications or relevant circumstances. These include economic, workforce development, education, health, civic engagement, and social connections.
This survey is critically important to provide data supporting the significant contributions public libraries make in developing digitally engaged communities. Please take the time to complete this survey, as the information is valuable both on the state and national level.
The survey is managed by ALA and the University of Maryland Information and Policy and Access Center. Funding comes from the Institute of Museum and Library Services (IMLS), the International City/County Management Association (ICMA) and the ALA Office for Information technology Policy (OITP). For more information, visit the University of Maryland, digital inclusion
survey website.
If you have lost or forgotten your code, a list of
login codes for your particular library is also available (they are the same is your Bibliostat™ Collect login). Note that branch libraries are listed individually; each branch should complete their own survey, if possible. Not doing so means that the useful demographic information for each branch is not available, and answers may vary among branches.
To underscore the importance of this survey, please take a look at
last year’s results. The
Nebraska page offers an interactive map that is searchable by geographic location or library name. It contains a wealth of specific information, including demographics, economics, education, health, and summary from last year’s survey. If you scroll down, you can see how Nebraska compares to the national averages for technology, digital literacy, and library programs. The site also contains the full
national report, as well as a
talking points handout.

